You might be surprised to hear that not only can linear regression fit lines between a response variable Y and one or more predictor variables, X, it can fit curves too. There are many ways to do this, but the simplest is by adding a polynomial term.
So what is a polynomial term and how do you know you need one?
The linear parameters in a regression model
A linear regression model has a few key parameters. These include the intercept coefficient, the slope coefficient, and the residual variance.
That intercept defines the height of the regression line. It does so by measuring the height of the line at one specific point: when all X = 0.
The slope defines how much Y differs, on average, for each one unit difference in X. In other words, it measures the constant relationship between X and Y. Yes, there can be multiple Xs and each one has its own slope.
A polynomial term–a quadratic (squared) or cubic (cubed) term turns a linear regression model into a curve.
(more…)
 How do you know when to use a time series and when to use a linear mixed model for longitudinal data?
What’s the difference between repeated measures data and longitudinal?
(more…)
 Regression is one of the most common analyses in statistics. Most of us learn it in grad school, and we learned it in a specific software. Maybe SPSS, maybe another software package. The thing is, depending on your training and when you did it, there is SO MUCH to know about doing a regression analysis in SPSS.
(more…)
Do you ever wish your data analysis project were a little more organized?
(more…)
How do you know which method to use when you want to compare groups?
(more…)
If you’ve used much analysis of variance (ANOVA), you’ve probably heard that ANOVA is a special case of linear regression. Unless you’ve seen why, though, that may not make a lot of sense. After all, ANOVA compares means between categories, while regression predicts outcomes with numeric variables.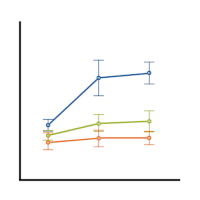 (more…)