Why We Needed a Random Sample of 6 numbers between 1 and 10000
As you may have read in one of our recent newsletters, this month The Analysis Factor hit two milestones:
- 10,000 subscribers to our mailing list
- 6 years in business.
We’re quite happy about both, and seriously grateful to all members of our community.
So to celebrate and to say thanks, we decided to do a giveaway to 6 randomly-chosen newsletter subscribers.
I just sent emails to the 6 winners this morning.
How We Randomly Generated 6 Equally Likely Values out of 10000 Using R Commander
And since randomly generating numbers is something you often need to do in research, I thought I would let you know how we did it.
I decided to use R Commander as it’s extremely easy to use, and I wanted to check it out for our upcoming workshop.
Here’s how I did it.
I exported the names and email addresses of everyone on our mailing list into excel and sorted by the date and time in which they subscribed.
We actually had 10010 email addresses on the list, but I removed those of our employees, which brought us down to exactly 10,000.
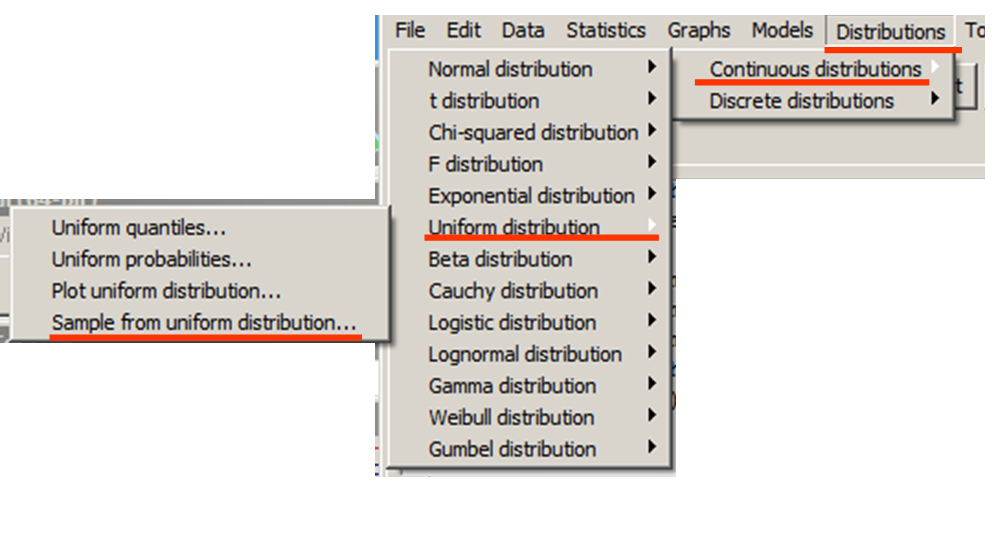
In R commander, I simple asked for it to create a random sample from a uniform distribution.
As you can see from the menus, it’s possible to get a random sample from many different distributions, but I wanted Uniform, which has an equal probability of every value within a specific range.
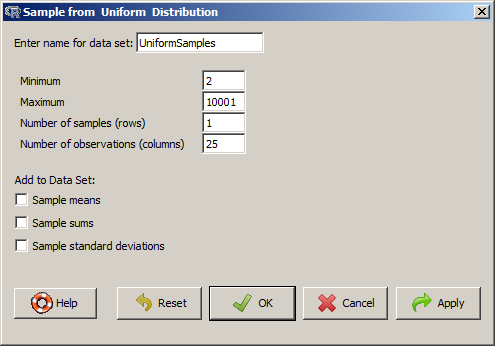
This brings up this dialog box. Because the first row of my excel spreadsheet contained the Variable names (name, email address, etc.) I didn’t want to randomly choose row 1. So I started it at 2 and went through 10001.
I technically only needed 6 observations, not 25, but wanted to select a few extra people, just in case someone is using an old email address and doesn’t respond to our offer.
Sure, 25 was probably overkill, but hey, I like to have backups.
And this is what the data look like:
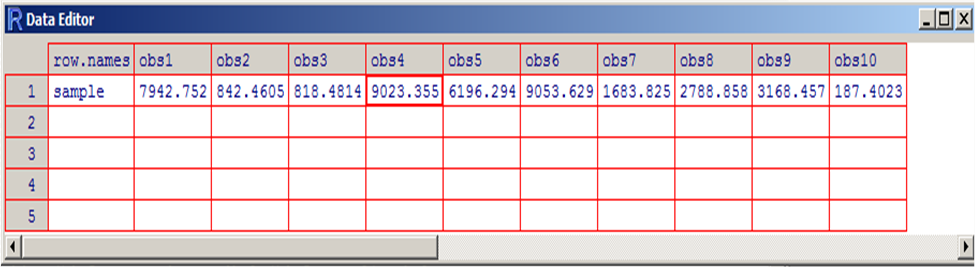
As you can see, one of the very nice things about R Commander is being able to see and edit the data set.
The other nice thing is that, much like the Paste function in SPSS, R commander doesn’t just run whatever you choose in the menus, it also pastes the code for those menu options into a script window.
At the top is the code for what I just did in the menus. The nice thing is that this script is editable. Say I realized that 25 really was too many. I can simply change that 25 to something like 12 (it’s not hard to find in the script), then hit Submit and it will rerun it.
This is a great way to learn R code without having to struggle with lots of errors.
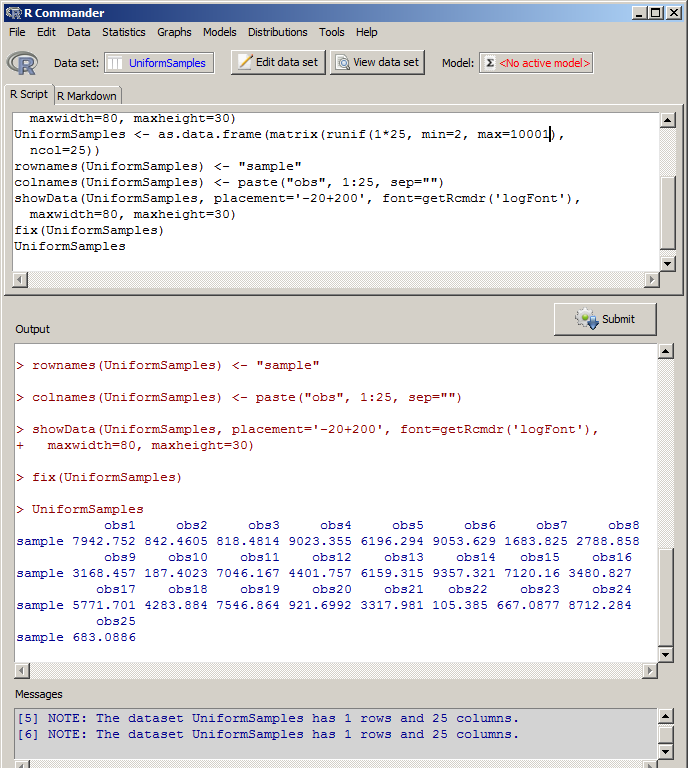
The output, as you can see, is at the bottom. I simply copied and pasted these into an excel file, rounded off to the nearest integer, and matched up the random numbers from my sample with the row numbers in excel.
Leave a Reply