Ever consider skipping the important step of cleaning your data? It’s tempting but not a good idea. Why? It’s a bit like baking.
I like to bake. There’s nothing nicer than a rainy Sunday with no plans, and a pantry full of supplies. I have done my shopping, and now it’s time to make the cake. Ah, but the kitchen is a mess. I don’t have things in order. This is no way to start.
First, I need to clear the counter, wash the breakfast dishes, and set out my tools. I need to take stock, read the recipe, and measure out my ingredients. Then it’s time for the fun part. I’ll admit, in my rush to get started I have at times skipped this step.
(more…)
Tell me if you can relate to this:
You love your field of study, you enjoy asking the big questions and discovering answers. But, when it comes to data analysis and statistics you get a little bogged down. You might even feel a bit lost sometimes.
And that is hard to admit.
Because after all, you are supposed to be the expert. Right?
Learning Statistics is Hard but We Make it a Lot Easier
The thing is, statistics is a field unto itself. But as a researcher, you need to be adept with statistics even though you may only have very basic training in this field. In essence, you learned statistics — a new language — out of context. You had no real immersion experience to practice this language. You had few opportunities to apply the strange new terms and concepts as you learned them.
At the Analysis Factor, we understand the pain of learning and doing statistics. We have been in the trenches with hundreds of researchers like you across many fields of study. Everyone is struggling to grow their statistical, data analysis, and software skills.

In Statistically Speaking we support and guide you as you learn — every step of the way. We know where to start, where to go next, and next, and next.
We know that your field and research question(s) determine the type of data and complexity of statistical analyses you will choose. And we know that everyone shows up in a different place, and needs different things to help them get where they need to go.
So we have created a treasure trove of resources on hundreds of topics — from data cleaning and research design to logistic regression and structural equation modeling.
And to keep it all about you, we have created a customizable learning platform, one where you make a plan for your own unique journey. We have crafted a series of comprehensive Maps, curated guides on essential topics at each Stage of mastery, offering you a structured pathway through the maze of statistical knowledge.
You create the plan you need, and choose the maps you need to do your research.
Maps
At The Analysis Factor, we classify the statistical content and skills into 4 Stages to help you decide where to begin your learning journey. In Statistically Speaking, the Maps are categorized into these Stages.
Here are just a few examples:
Stage 1: Fundamentals
-
Preparing Data: Understanding the fundamental steps in data preparation, from cleaning and transforming to structuring datasets for analysis.
-
Bivariate Statistics: Grasping the basics of relationships between two variables, laying the groundwork for more complex analyses.
Stage 2: Linear Models
-
Graphing: Learning visualization techniques to represent data and derive meaningful insights.
-
Introduction to Regression: Unraveling the fundamentals of regression analysis, a cornerstone of statistical modeling.
-
Interpreting Results: Developing the skill to interpret statistical results and draw valid conclusions from analyses.
Stage 3: Extensions of Linear Models
-
Count Models: Exploring specialized models for count data analysis, understanding their application and nuances.
-
Logistic Regression: Diving into binary outcome analysis, understanding probabilities, and logistic models.
-
Factor Analysis: Delving into multivariate analysis, understanding latent variables and their relationships.
Stage 4: Advanced Models
-
GLMM: Embracing the complexity of generalized linear mixed models, integrating fixed and random effects.
-
SEM: Venturing into structural equation modeling, exploring complex relationships among variables.
-
Survival Analysis: Understanding time-to-event data, its application in various fields, and survival modeling techniques.
By mapping out the key content and skills you want to learn at each Stage, you’ll gain a clearer understanding of the vast statistical landscape and feel empowered to take on the learning journey ahead.
So, what are you waiting for? Members, head on over to explore the Maps in Statistically Speaking.
And if you are not yet a member, you can sign-up for our waitlist to join Statistically Speaking. We would love to meet you, learn about your research, and help you get started on your statistical learning adventure.
There are important ‘rules’ of statistical analysis. Like
- Always run descriptive statistics and graphs before running tests
- Use the simplest test that answers the research question and meets assumptions
- Always check assumptions.
But there are others you may have learned in statistics classes that don’t serve you or your analysis well once you’re working with real data.
When you are taking statistics classes, there is a lot going on. You’re learning concepts, vocabulary, and some really crazy notation. And probably a software package on top of that.
In other words, you’re learning a lot of hard stuff all at once.
Good statistics professors and textbook authors know that learning comes in stages. Trying to teach the nuances of good applied statistical analysis to students who are struggling to understand basic concepts results in no learning at all.
And yet students need to practice what they’re learning so it sticks. So they teach you simple rules of application. Those simple rules work just fine for students in a stats class working on sparkling clean textbook data.
But they are over-simplified for you, the data analyst, working with real, messy data.
Here are three rules of data analysis practice that you may have learned in classes that you need to unlearn. They are not always wrong. They simply don’t allow for the nuance involved in real statistical analysis.
The Rules of Statistical Analysis to Unlearn:
1. To check statistical assumptions, run a test. Decide whether the assumption is met by the significance of that test.
Every statistical test and model has assumptions. They’re very important. And they’re not always easy to verify.
For many assumptions, there are tests whose sole job is to test whether the assumption of another test is being met. Examples include the Levene’s test for constant variance and Kolmogorov-Smirnov test, often used for normality. These tests are tools to help you decide if your model assumptions are being met.
But they’re not definitive.
When you’re checking assumptions, there are a lot of contextual issues you need to consider: the sample size, the robustness of the test you’re running, the consequences of not meeting assumptions, and more.
What to do instead:
Use these test results as one of many pieces of information that you’ll use together to decide whether an assumption is violated.
2. Delete outliers that are 3 or more standard deviations from the mean.
This is an egregious one. Really. It’s bad.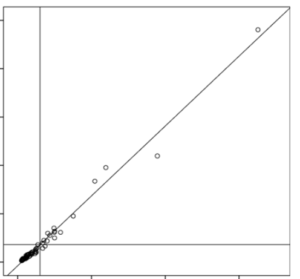
Yes, it makes the data look pretty. Yes, there are some situations in which it’s appropriate to delete outliers (like when you have evidence that it’s an error). And yes, outliers can wreak havoc on your parameter estimates.
But don’t make it a habit. Don’t follow a rule blindly.
Deleting outliers because they’re outliers (or using techniques like Winsorizing) is a great way to introduce bias into your results or to miss the most interesting part of your data set.
What to do instead:
When you find an outlier, investigate it. Try to figure out if it’s an error. See if you can figure out where it came from.
3. Check Normality of Dependent Variables before running a linear model
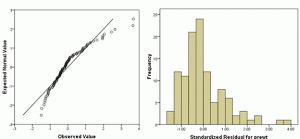 In a t-test, yes, there is an assumption that Y, the dependent variable, is normally distributed within each group. In other words, given the group as defined by X, Y follows a normal distribution.
ANOVA has a similar assumption: given the group as defined by X, Y follows a normal distribution.
In linear regression (and ANCOVA), where we have continuous variables, this same assumption holds. But it’s a little more nuanced since X is not necessarily categorical. At any specific value of X, Y has a normal distribution. (And yes, this is equivalent to saying the errors have a normal distribution).
But here’s the thing: the distribution of Y as a whole doesn’t have to be normal.
In fact, if X has a big effect, the distribution of Y, across all values of X, will often be skewed or bimodal or just a big old mess. This happens even if the distribution of Y, at each value of X, is perfectly normal.
What to do instead:
Because normality depends on which Xs are in a model, check assumptions after you’ve chosen predictors.
Conclusion:
The best rule in statistical analysis: always stop and think about your particular data analysis situation.
If you don’t understand or don’t have the experience to evaluate your situation, discuss it with someone who does. Investigate it. This is how you’ll learn.
Do I really need to learn R?
Someone asked me this recently.
Many R advocates would absolutely say yes to everyone who asks.
I don’t.
(I actually gave her a pretty long answer, summarized here).
It depends on what kind of work you do and the context in which you’re working.
I can say that R is (more…)
