• Skip to primary navigation
  • Skip to main content
  • Skip to primary sidebar
The Analysis Factor

The Analysis Factor

Statistical Consulting, Resources, and Statistics Workshops for Researchers

  • Home
  • Our Programs
    • Membership
    • Online Workshops
    • Free Webinars
    • Consulting Services
  • About
    • Our Team
    • Our Core Values
    • Our Privacy Policy
    • Employment
    • Collaborate with Us
  • Statistical Resources
  • Contact
  • Blog
  • Login

Reference Group

Your Questions Answered from the Interpreting Regression Coefficients Webinar

by Karen Grace-Martin Leave a Comment

Last week I had the pleasure of teaching a webinar on Interpreting Regression Coefficients. We walked through the output of a somewhat tricky regression model—it included two dummy-coded categorical variables, a covariate, and a few interactions.

As always seems to happen, our audience asked an amazing number of great questions. (Seriously, I’ve had multiple guest instructors compliment me on our audience and their thoughtful questions.)

We had so many that although I spent about 40 minutes answering [Read more…] about Your Questions Answered from the Interpreting Regression Coefficients Webinar

Tagged With: dummy coding, dummy variable, effect size, eta-square, Interpreting Interactions, interpreting regression coefficients, Reference Group, spotlight analysis, statistical significance

Related Posts

  • Using Marginal Means to Explain an Interaction to a Non-Statistical Audience
  • Interpreting Interactions in Linear Regression: When SPSS and Stata Disagree, Which is Right?
  • About Dummy Variables in SPSS Analysis
  • Interpreting (Even Tricky) Regression Coefficients – A Quiz

Strategies for Choosing the Reference Category in Dummy Coding

by Karen Grace-Martin 8 Comments

Every statistical software procedure that dummy codes predictor variables uses a default for choosing the reference category.

This default is usually the category that comes first or last alphabetically.

That may or may not be the best category to use, but fortunately you’re not stuck with the defaults.

So if you do choose, which one should you choose? [Read more…] about Strategies for Choosing the Reference Category in Dummy Coding

Tagged With: dummy coding, Reference Group

Related Posts

  • Your Questions Answered from the Interpreting Regression Coefficients Webinar
  • Member Training: Dummy and Effect Coding
  • How to Interpret the Intercept in 6 Linear Regression Examples
  • When Dummy Codes are Backwards, Your Stat Software may be Messing With You

When Dummy Codes are Backwards, Your Stat Software may be Messing With You

by Karen Grace-Martin 2 Comments

One of the tricky parts about dummy coded (0/1) variables is keeping track of what’s a 0 and what’s a 1.

This is made particularly tricky because sometimes your software switches them on you.

Here’s one example in a question I received recently.  The context was a Linear Mixed Model, but this can happen in other procedures as well.

I dummy code my categorical variables “0” or “1” but for some reason in the [Read more…] about When Dummy Codes are Backwards, Your Stat Software may be Messing With You

Tagged With: dummy coding, Reference Group

Related Posts

  • Dummy Coding in SPSS GLM–More on Fixed Factors, Covariates, and Reference Groups, Part 1
  • SPSS GLM or Regression? When to use each
  • SPSS GLM: Choosing Fixed Factors and Covariates
  • Centering a Covariate to Improve Interpretability

Dummy Coding in SPSS GLM–More on Fixed Factors, Covariates, and Reference Groups, Part 1

by Karen Grace-Martin 2 Comments

If you have a categorical predictor variable that you plan to use in a regression analysis in SPSS, there are a couple ways to do it.

You can use the SPSS Regression procedure.  Or you can use SPSS GLM, which I discuss here and in a follow-up post.

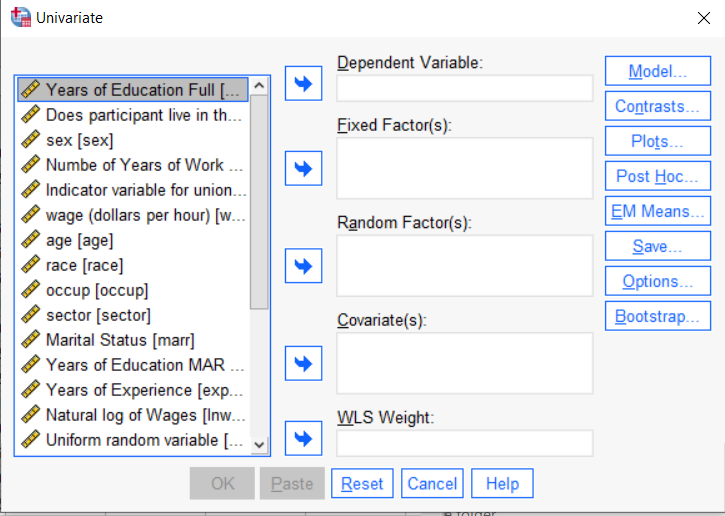
The big question in SPSS GLM is what goes where.  As I’ve detailed in another post, any continuous independent variable goes into covariates.  And don’t use random factors at all unless you really know what you’re doing.

So the question is what to do with your categorical variables.  You have two choices, and each has advantages and disadvantages.

The easiest is to put categorical variables in Fixed Factors.  SPSS GLM will dummy code those variables for you, which is quite convenient if your categorical variable has more than two categories.

However, there are some dummy coding defaults you need to be aware of that may or may not make this a good choice.

SPSS GLM always makes the reference group the one that comes last alphabetically.

So if the values you input are strings, it will be the one that comes last.  If those values are numbers, it will be the highest one.

(Note: Not all procedures in SPSS use this default so double check the default if you’re using something else. Some procedures let you change it the default, but SPSS GLM doesn’t).

In some studies it really doesn’t matter which is the reference group.

But in others, interpreting regression coefficients will be a whole lot easier if you choose a group that makes a good comparison such as a control group or the most common group in the data.

If you want that to be the reference group in SPSS GLM, make it come last alphabetically.  I’ve been known to do things like change my data so that the control group becomes something like ZControl.  (But create a new variable–never overwrite original data).

It really can get confusing, though, if the variable was already dummy coded–if it already had values of 0 and 1.  Because 1 comes last alphabetically, SPSS GLM will make that group the reference group and internally code it as 0.

This can really lead to confusion when interpreting coefficients.  It’s not impossible if you’re paying attention, but you do have to pay attention.


Tagged With: Covariate, dummy coding, Fixed Factor, interpreting regression coefficients, Reference Group, SPSS GLM

Related Posts

  • SPSS GLM: Choosing Fixed Factors and Covariates
  • Dummy Coding in SPSS GLM–More on Fixed Factors, Covariates, and Reference Groups, Part 2
  • When Dummy Codes are Backwards, Your Stat Software may be Messing With You
  • SPSS GLM or Regression? When to use each

Primary Sidebar

This Month’s Statistically Speaking Live Training

  • Member Training: Assumptions of Linear Models

Upcoming Free Webinars

The Pathway: Steps for Staying Out of the Weeds in any Data Analysis

Upcoming Workshops

  • Analyzing Count Data: Poisson, Negative Binomial, and Other Essential Models (Jul 2022)
  • Introduction to Generalized Linear Mixed Models (Jul 2022)

Copyright © 2008–2022 The Analysis Factor, LLC. All rights reserved.
877-272-8096   Contact Us

The Analysis Factor uses cookies to ensure that we give you the best experience of our website. If you continue we assume that you consent to receive cookies on all websites from The Analysis Factor.
Continue Privacy Policy
Privacy & Cookies Policy

Privacy Overview

This website uses cookies to improve your experience while you navigate through the website. Out of these, the cookies that are categorized as necessary are stored on your browser as they are essential for the working of basic functionalities of the website. We also use third-party cookies that help us analyze and understand how you use this website. These cookies will be stored in your browser only with your consent. You also have the option to opt-out of these cookies. But opting out of some of these cookies may affect your browsing experience.
Necessary
Always Enabled
Necessary cookies are absolutely essential for the website to function properly. This category only includes cookies that ensures basic functionalities and security features of the website. These cookies do not store any personal information.
Non-necessary
Any cookies that may not be particularly necessary for the website to function and is used specifically to collect user personal data via analytics, ads, other embedded contents are termed as non-necessary cookies. It is mandatory to procure user consent prior to running these cookies on your website.
SAVE & ACCEPT