two-way table

Two-Way Tables and Count Models: Expected and Predicted Counts

December 29th, 2016 by

In a previous article, we discussed how incidence rate ratios calculated in a Poisson regression can be determined from a two-way table of categorical variables.

Statistical software can also calculate the expected (aka predicted) count for each group. Below is the actual and expected count of the number of boys and girls participating and not participating in organized sports.

cm-twowaytables-1


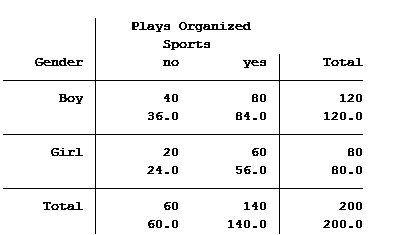
The value in the top of each cell is the actual count (40 boys do not play organized sports) and the bottom value is the expected/predicted count (36 boys are predicted to not play organized sports).

The Poisson model that we ran in the previous article generated the following table: (more…)


Understanding Incidence Rate Ratios through the Eyes of a Two-Way Table

December 27th, 2016 by

The coefficients of count model regression tables are shown in either logged form or as incidence rate ratios. Trying to explain the coefficients in logged form can be a difficult process.

Incidence rate ratios are much easier to explain. You probably didn’t realize you’ve seen incidence rate ratios before, expressed differently.

Let’s look at an example.

A school district was interested in how many children in their sixth grade classes played on organized sports teams. So they did a count and also noted the gender of the child. The results were put into a table: (more…)