new blog post: Member Training: Dummy and Effect Coding
Previous Posts

A Covariance Matrix, like many matrices used in statistics, is symmetric. That means that the table has the same headings across the top as it does along the side. The thing to keep in mind when it all gets overwhelming is a matrix is just a table. That's it.
Reason 5: The biggest benefit of doing these calculations is to not waste years and thousands of dollars in grants or tuition pursuing an impossible analysis. If sample size calculations indicate you need a thousand subjects to find significant results but time, money, or ethical constraints limit you to 50, don't do that study.
You're dealing with both a complicated modeling technique (survival analysis, logistic regression, multilevel modeling) and tricky effects in the model (dummy coding, interactions, and quadratic terms). The only way to figure it all out in a situation like that is to break it down into parts. Trying to understand all those complicated parts together is a recipe for disaster. But if you can do linear regression, each part is just one step up in complexity. Take one step at a time.
The takeaway for you, the researcher and data analyst: 1. Give yourself a break if you hit a snag. Even very experienced data analysts, statisticians who understand what they're doing, get stumped sometimes. Don't ever think that performing data analysis is an IQ test. You're bringing together many skills and complex tools.
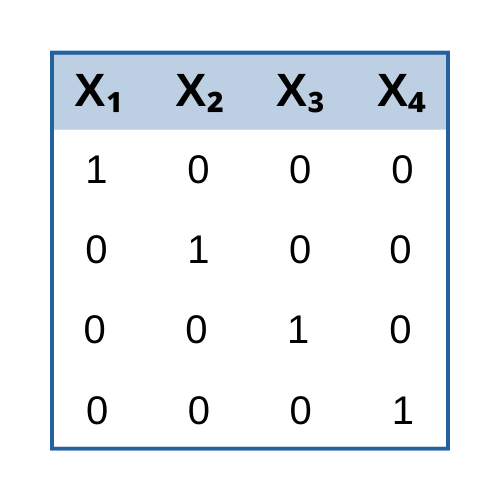
In SAS proc glm, when you specify a predictor as categorical in the CLASS statement, it will automatically dummy code it for you in the parameter estimates table (the regression coefficients). The default reference category--what GLM will code as 0--is the highest value. This works just fine if your values are coded 1, 2, and 3. But if you've dummy coded them already, it's switching them on you.
But if the point is to answer a research question that describes relationships, you're going to have to get your hands dirty. It's easy to say "use theory" or "test your research question" but that ignores a lot of practical issues. Like the fact that you may have 10 different variables that all measure the same theoretical construct, and it's not clear which one to use.
Q: Do most high impact journals require authors to state which method has been used on missing data? I'm sure there are some fields or research areas in which not having missing data isn't a possibility, so they're going to want an answer.
Sure. One of the big advantages of multiple imputation is that you can use it for any analysis. It's one of the reasons big data libraries use it--no matter how researchers are using the data, the missing data is handled the same, and handled well.
Here's a little SPSS tip. When you create new variables, whether it's through the Recode, Compute, or some other command, you need to check that it worked the way you think it did. (As an aside, I hope this goes without saying, but never, never, never, never use Recode into Same Variable. Always Recode into New Variable so you
I actually wish R had been around, and I wish all the great resources for learning it that exist now, existed then. Here's one of them. A very lovely-looking R tutorial series by John M. Quick.
 stat skill-building compass