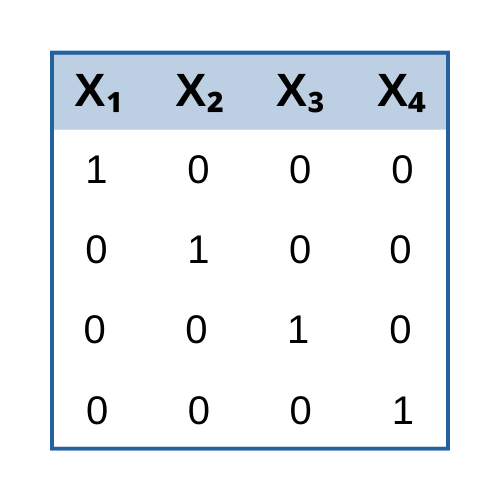
new blog post: Member Training: Dummy and Effect Coding
Previous Posts
How do you then do a cross-tabulation in SPSS when you do not have a dataset with the values of the two variables of interest? For example, if you do a critical appraisal of a published study and only have proportions and denominators. In this article it will be demonstrated how SPSS can come up with a cross table and do a Chi-square test in both situations. And you will see that the results are exactly the same.
If you don't have many variables to recode, say one or two, it's not a big deal to use the menus (but at least paste the code, so you have a record of what you did later!). But if you have more than just one or two, all those mouse-clicks get old, fast.
In a marginal model, we can directly estimate the correlations among each individual's residuals. (We do assume the residuals across different individuals are independent of each other). We can specify that they are equally correlated, as in the RM ANOVA, but we're not limited to that assumption. Each correlation can be unique, or measurements closer in time can have higher correlations than those farther away. There are a number of common patterns that the residuals tend to take.
Can I use SPSS MIXED models for (a) ordinal logistic regression, and (b) multi-nomial logistic regression? Every once in a while I get emailed a question that I think others will find helpful. This is definitely one of them. My answer:
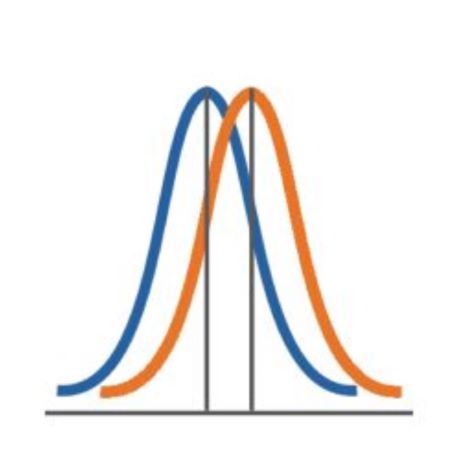
Ever discover that your data are not normally distributed, no matter what transformation you try? It may be that they follow another distribution altogether. During this teleseminar, Karen Grace-Martin explained how these regression models differ from Ordinary Linear Regression the type of data for which each is appropriate how to interpret the coefficients and odds […]
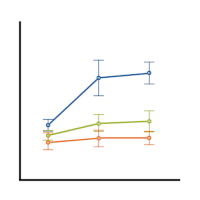
This free, one-hour webinar is part of our regular Craft of Statistical Analysis series. In it, we will introduce and demonstrate two of the core concepts of mixed modeling—the random intercept and the random slope. Most scientific fields now recognize the extraordinary usefulness of mixed models, but they’re a tough nut to crack for someone […]
Most scientific fields now recognize the extraordinary usefulness of mixed models, but they’re a tough nut to crack for someone who didn’t receive training in their methodology.
Another set of effect size measures for categorical independent variables have a more intuitive interpretation, and are easier to evaluate. They include Eta Squared, Partial Eta Squared, and Omega Squared. Like the R Squared statistic, they all have the intuitive interpretation of the proportion of the variance accounted for.
Luckily, all the effect size measures are relatively easy to calculate from information in the ANOVA table on your output. Here are a few common ones:
What saved me, years ago, is the Microsoft Equation Editor. I just mentioned it to a client the other day. She was thrilled at the ease and flexibility of it, so I thought I'd better share this.
 stat skill-building compass