new blog post: Member Training: Dummy and Effect Coding
Previous Posts
These assumptions are explicitly stated by the model: 1.The residuals are independent 2.The residuals are normally distributed 3.The residuals have a mean of 0 at all values of X 4.The residuals have constant variance
By having one variable for number of days and another that indicates whether censoring occurs, we can account for censoring in calculating each person's risk of the event occurring.
So one cause of censoring is merely that we can't follow people forever. At some point you have to end your study, and not all people will have experienced the event. But another common cause is that people are lost to follow-up during a study. This is called random censoring. It occurs when follow-up ends for reasons that are not under control of the investigator.
Covariate is a tricky term in a different way than hierarchical or beta, which have completely different meanings in different contexts. Covariate really has only one meaning, but it gets tricky because the meaning has different implications in different situations, and people use it in slightly different ways. And these different ways of using the […]
One of the places that SPSS syntax excels at efficiency is when you’re creating new variables. This is especially true when you’re creating a LOT of new variables, but even one or two can be quicker if you write the syntax code instead of menus. And just as importantly, you’ll have documentation for exactly how […]
If you use the menus in SPSS, you can only get those EMMeans at the Covariate's mean, which in this example is about 25, where the vertical black line is. This isn't very useful for our purposes. But we can change the value of the covariate at which to compare the means using syntax.
But that's really just one application of a linear model with one categorical and one continuous predictor. The research question of interest doesn't have to be about the categorical predictor, and the covariate doesn't have to be a nuisance variable. A regression model with one continuous and one dummy variable is the same model (actually, you'd need two dummy variables to cover the three categories, but that's another story).
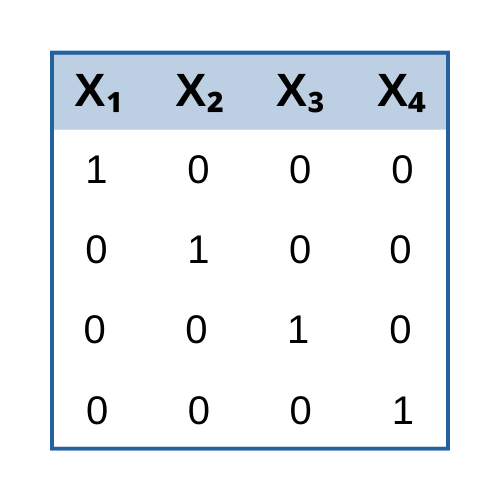
I know that if I included 5 dummy location variables (6 locations in total, with A as the reference group) in 1 block of the regression analysis, the result would be based on the comparison with the reference location. Then what if I put 6 dummies (for example, the 1st dummy would be "1" for A location, and "0" for otherwise) in 1 block? Will it be a bug? If not, how to interpret the result?
Assume you have just done a cohort study. How do you actually do the cross-tabulation to calculate the cumulative incidence in both groups? Let's take as example a cohort study used to see whether there is a causal relationship between the use of a certain water source and the incidence of diarrhea among children under five in a village with different water sources. In this case, the variable diarrhea (yes/no) should be in the columns. The variable water source (suspected/other) should be in the rows.
But they're not the only ones. Another is having a system in place to keep track of the analyses. This is especially important if you have any collaborators (or a statistical consultant!) you'll be sharing your results with. You may already have an effective work flow, but if you don't, here are some strategies I use. I hope they're helpful to you.
 stat skill-building compass