There are many effect size statistics for ANOVA and regression, and as you may have noticed, journal editors are now requiring you include one.
Unfortunately, the one your editor wants or is the one most appropriate to your research may not be the one your software makes available (SPSS, for example, reports Partial Eta Squared only, although it labels it Eta Squared in early versions).
Luckily, all the effect size measures are relatively easy to calculate from information in the ANOVA table on your output. Here are a few common ones:
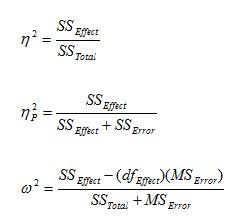
Eta Squared, Partial Eta Squared, and Omega Squared Formulas
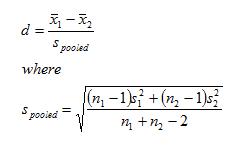
Cohen’s d formula
You have to be careful, if you’re using SPSS, to use the correct values, as SPSS labels aren’t always what we think. For example, for SSTotal, use what SPSS labels SS Corrected Total.
What SPSS labels SS Total actually also includes SS for the Intercept, which is redundant to other information in the model.
The denominator for Cohen’s d is always some measure of standard deviation. I’ve shown s pooled here, but you often see different options, including just using one sample’s s. This is the one I see used most commonly.

A new universal effect size measure has been proposed – the e value.
It ranges from -1 to +1, with zero being no effect.
The e value replaces confusing (difficult to interpret) effect size measures such as partial eta sq, Cohen’s d, odds ratio etc.
See:
Hashim MJ. A New Standardised Effect Size, e. J Coll Physicians Surg Pak. 2019;29(2):197-198. doi:10.29271/jcpsp.2019.02.197
Hi,
May I know how can we explain a small, medium and large effect with, for example, Cohen d? Is there a simple way to explain to non-statistic person like me? Thanks.
Hi Clara,
Cohen did make suggestions in his 1988 (I think) book about what constitutes a small, medium, or large effect for a Cohen’s d in his field. Some people erroneously apply those values to everything, which isn’t a good idea. We have a nice training on effect size statistics and how to think about them in our Statistically Speaking membership.
Hi Karen,
Is there any difference about the formular of Partial Eta Squared if used in different experiment design, such as univariate analysis of randomized block variance and Single factor repeated measurement ANOVA?
Thanks!
Hi Karen,
what’s the difference between Eta Squared and Partial Eta Squared? Is the SS(Total) equal to SS(Effect) plusing SS(Error)?
And I have question to ask you about what kind of analysis of variance do you think to use if analying four groups of affective pictures about the arousal?
Hi
I did calculate the effect size of treatment (cohens d ) now i would like to calculate the interaction between the treatment and the independent variable ( covariance ) to calculate the effect size for each (eta square ) how can I do it using spss?
25 teacher and 150 students , how can we calculate omega square in spss
Hi
I am using repeated measure ANOVA to see the difference between 6 groups (i measure the muscle power when perform 6 different sporting tasks and i want to see is the muscle power different between these 6 tasks). My question is: is it possible to calculate the effect size in such case and how?
thnaks
Yes ,you can.In estimate effect size option.
if i use One sample t test, can i calculate Effect Size? and How to Calculate?
Eta Squared?
Cohen’s d
good day
how do i calculate effect size from mean and confidence intervals?
I am assessing effect of government’s incubation service quality to increase performance of SMMEs and I am using SERQUAL. I am checking the relationship between the 5 dimensions and satisfaction as well as the correlation between the satisfaction and performance i.e. revenue and employment. Which effect size explains the practical difference?
Mphikeleli
Hello,
Just to be clear, when calculating the total ss from SPSS output for eta-squared: you add up the sums of squares for each of the main effects, interactions, and for all of the errors (i.e., each ss for each main effect and interaction)
Thanks
VIkki
Is it possible to report eta-squared values as “small,medium,large” effect size?
It’s possible, and often done, but not a good idea.
Hi,
I have both paired and independent samples t-tests. I was wondering what effect size measure I should use?
Both Cohens D, and r seem quite difficult to calculate for paired samples. Can partial eta squared be calculated using general linear model- univariate in SPSS?
Thanks
Heather
Can you calculate eta squared from a kruskal-wallis test using chi squared?
Hi,
Page has helped me greatly but I seem to be going in circles on what I should actually report. I have performed a two within repeated measures study and SPSS is giving me partial eta as effect size. Do I just report that or should I be turning it into something else? I read somewhere about squaring the partial eta and using that value for something but as you can see I am getting pretty lost.
Hope that makes sense, thanks in advance for the help!
Hello,
I have done a 2x2x2 study, so with spss I ran an three-way repeated measures ANOVA (analyze -> GLM -> repeated measures). Now, I would like to calculate the proportions of variability explained by each one of my three independent variables, by error and by interactions. To do so, I think, I have to calculated the eta squared for each effect. Thus I will have SS effect/SS total … now, the first data is easy to find because in the spss output you find typeIII sum of squares that is SS effect – the problem is how to calculate SS total. What do I have to add to find SS total?
Can you help me with that?
thank you very much,
Francesco
Hi,
I am currently doing a research and found that my Cohen’s d value is greater than one (6.934).
Say, for treatment group M=128.5250 SD=9.54876 and control group M=76.1750 and SD=4.77648. I have used your formula, with S pooled. and the result was 6.934. Am i doing it rightly? because the Cohen’s d value usually not more than 1.
Hi Khairul,
It’s fine. You’re right that Cohen’s d usually isn’t bigger than 1, but it’s not impossible. You just have a really big effect. The difference in your two means is the size of nearly 7 std deviations.
Hi Karen,
Is there a way to test, statistically, if the effect sizes (say, partial eta squared) from two ANOVAs are different or the same. For example, for a congruent seller and a congruent buyer, the effect size (i.e., partial η²) was .259. This same analysis was then conducted for an incongruent seller and an incongruent buyer resulting in an effect size of .342.
Thanks.
Hi Karen,
Thanks for a wonderful website! I wonder if you could help me with a problem. When I compute a two-way ANOVA in SPSS I have no problem with calculating Cohen’s d for the two main effects based on M and SD (for example in online effect size calculators). However, I really can’t figuring out how to calculate Cohen’s d for the interaction effect. What among the information in the ANOVA table in my SPSS output should I use and in what way? I really hope you can help me out. Thanks in advance
Hi Daniel,
A Cohen’s d is really a measure of a mean difference. It doesn’t really make sense to calculate it for an interaction (which is a difference between two or more mean differences). That’s probably why you can’t find it. 🙂
Hi, Daniel – I had this same question as well. I’m working on an assignment that asks me to calculate Cohen’s d for my main effects and for an interaction. For the main effects, I had NO problems, but for the interaction, I’m having trouble knowing WHICH means to use to find the difference and which SDs to use to calculate Pooled SD. From Karen’s reply, it seems that this isn’t something I should be trying to calculate. Why would my assignment be to find this if it’s so irrelevant?
Hi Michael,
If this is for a class I would suggest clarifying with the instructor what they’re looking for. The only thing I could think of is calculating d for each of the simple effects within the interaction. I still don’t see why this would be helpful, but maybe your professor has a good reason for asking for it. I think Eta Squared makes more sense for an interaction, personally.
Karen,
Isn’t the reason that we do ANOVA so that we can then do post hoc tests? What’s the point of having an interaction term in your model, finding it to be significant, then not doing a post hoc test, such as a Tukey’s, to find out more precisely which slopes are different? In which case, you could calculate cohen’s d (or better yet hedges’s g) for each pair that is different.
The partial eta squared values aren’t that informative when your factors have more than two levels, correct?
Am I missing something?
Cheers,
Cory
Hi Karen,
having studied some papers, I came to conclusion that eta squared is used as effect size for Two-way ANOVA. eta squared, not partial eta squared… am I right? how can I calculated effect size for two-way ANOVA in spss? is there any rule for the sum of eta squared of variables (corrected model, intercept, variable x, variable Y, interaction (variable x and y)) ????
thanks in advance
Hi Karen,
Thanks for a wonderful resource! I’m trying to figure out which effect size is most appropriate for small sample size (n=29) and unequal/unbalanced cell sizes for my 2×2 ANOVA. Can you advise?
Thank you!
Hi Karen,
Thanks for such a great resource. Makes life simpler. I had two questions.
1) I was going through some papers and wanted to compare my data’s effect size with those papers. So is it possible to calculate partial eta squared from F value, df ?
2) Cohen’s d follows a classification system based on their effect sizes (Cohen, 1992) i.e. Cohen’s d = .10 = weak effect
Cohen’s d = .30 = moderate effect
Cohen’s d = .50 = strong effect
Is there a similar classification for partial eta squared effect sizes as well. If yes, do you know any reference on top of your mind?
Thank you.
Yatin
Hi Yatin,
Not that I know of, although the nice thing about eta squared is it’s a percentage, so you should be able to evaluate whether it’s a large or small percentage. I don’t like these “t-shirt sizes” for Cohen’s d anyway. I talked about this in my Effect Size Statistics webinar. It’s a free download.
I just wanted to know whether you have to use cohens d to find the effect size for an independent samples t-test or can you use partial eta squared to represent the effect size of an independent samples t-test.
Hi Ryan,
You could do an eta squared, but you’d have to run it through anova instead of a t-test
Hi Karen,
What is the SD to calculate Cohen’s d For an ANCOVA? Can i use the square root of the MSerror of the ANCOVA?
Thank you!
Hi Anoop,
Yes. That sq root of the MSError (with the fancy name Root MSE or RSME) is an estimate of the pooled std deviation.
Thanks for a great resource. I have an omega squared value of w2 = 0.45
I need to change this into a standardized mean difference (cohen’s d). Can you suggest how to do so?
Hi KB,
As far as I know, you can’t do it. Omega Sq is based on % variance explained and Cohen’s d is based on mean differences. There should be many mean differences with the same SS, for example.
Hi Karen,
Do you know how to calculate an effect size for a planned contrast? E.g. I want to compare the means of 2 groups vs. the means of 3 groups and get Cohen’s d.
Thanks,
Kim
Hi Kim,
I’ve never heard of a Cohen’s d for a contrast, but I can’t think of a conceptual reason it shouldn’t work. Hmmm.
For a 2×2 between ANOVA, my table gives me .86 for the SS^effect , 6.564 for the SS^corrected total, and .131 for partial eta squared. When I use these calculations, it gives me .116 for partial eta squared, but .131 for eta squared!! I’m so confused now.
That indeed looks to be to be .131 for eta squared. Are there other effects in the model?
How do I calculate the eta squared from the partial eta squared I got using SPSS?
You can’t do it from partial eta squared, but you can from the SS using the formulas.
I have a question regarding Omega squared: can you use this formula for repeated measures or mixed designs? If not, then where can I find a formula for such situations? – I couldn’t find a clear answer to this anywhere.
Thank you!
Hi Ioana,
To my knowledge, no. I checked Keppel, and he said there are a few version of omega sq for repeated measures anovas, but they’re problematic. But my version of Keppel is not the most recent. Perhaps there is a better option now.
I do know that for a mixed model, there isn’t. You can estimate a Cohen’s d, though for a standardized mean difference score.