new blog post: Member Training: Dummy and Effect Coding
Previous Posts
Interaction is different. Whether two variables are associated says nothing about whether they interact in their effect on a third variable. Likewise, if two variables interact, they may or may not be associated.

In the world of data analysis, there’s not always one right statistical analysis for every research question. There are so many issues to take into account. They include the research question to be answered, the measurement of the variables, the study design, data limitations and issues, the audience, practical constraints like software availability, and the […]
Odds ratios are the bane of many data analysts. Interpreting them can be like learning a whole new language. This webinar will go over an example to show how to interpret the odds ratios in binary logistic regression. You will learn: how probability and odds both measure the same thing on different scales the meaning […]
Q: How high does the count scale have to be before you can consider it continuous? I suspect you're getting at the same issue as in the last question. It's certainly true that when you get into very large numbers, many of the issues with count variables aren't issues anymore.
For ANOVAs, two of the most popular are Eta-squared and partial Eta-squared. In one way ANOVAs, they come out the same, but in more complicated models, their values, and their meanings differ.him
One problem is that the mean age at which infants utter their first word may differ from one sample to another. This means you're not always evaluating that mean that the exact same age. It's not comparable across samples. So another option is to choose a meaningful value of age that is within the values in the data set. One example may be at 12 months.
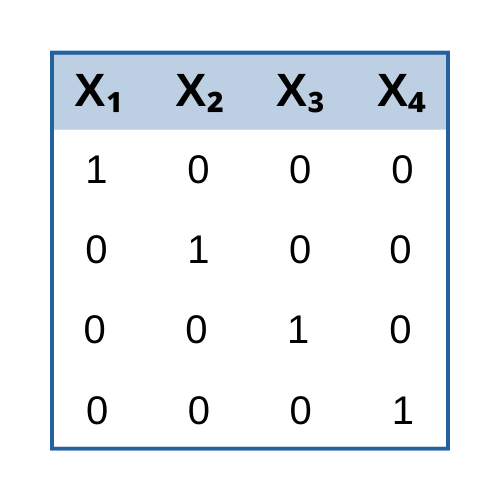
I recently received this great question: Question: Hi Karen, ive purchased a lot of your material and read a lot of your pdf documents w.r.t. regression and interaction terms. Its, now, my general understanding that interaction for two or more categorical variables is best done with effects coding, and interactions cont v. categorical variables is […]
Here's one example of the flexibility of mixed models, and its resulting potential for confusion and error. In repeated measures and longitudinal studies, the observations are clustered within a subject. That means the observations, and their residuals, are not independent. They're correlated. There are two ways to deal with this correlation.
In this webinar we’re doing something a little different – rather than give you an overivew of a topic, we will interpret together the regression coefficients table from a real data set. This data set is from the dissertation of a client I worked with a few years ago. She has graciously allowed us to […]
“Everything should be made as simple as possible, but no simpler” – Albert Einstein* For some reason, I’ve heard this quotation 3 times in the past 3 days. Maybe I hear it everyday, but only noticed because I’ve been working with a few clients on model selection, and deciding how much to simplify a model. […]
 stat skill-building compass