 How do you know when to use a time series and when to use a linear mixed model for longitudinal data?
What’s the difference between repeated measures data and longitudinal?
(more…)
How do you know when to use a time series and when to use a linear mixed model for longitudinal data?
What’s the difference between repeated measures data and longitudinal?
(more…)
If you’ve tried coding in Stata, you may have found it strange. The syntax rules are straightforward, but different from what I’d expect.
I had experience coding in Java and R before I ever used Stata. Because of this, I expected commands to be followed by parentheses, and for this to make it easy to read the code’s structure.
Stata does not work this way.
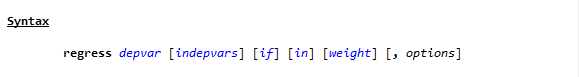
To see the way Stata handles a linear regression, go to the command line and type
h reg or help regress
You will see a help page pop up, with this Syntax line near the top.
(If you need a refresher on getting help in Stata, watch this video by Jeff Meyer.)
This is typical of how Stata code looks. (more…)
Standard deviation and standard error are statistical concepts you probably learned well enough in Intro Stats to pass the test. Conceptually, you understand them, yet the difference doesn’t make a whole lot of intuitive sense.
So in this article, let’s explore the difference between the two. We will look at an example, in the hopes of making these concepts more intuitive. You’ll also see why sample size has a big effect on standard error. (more…)
There’s no mincing words here. Missing values can cause problems for every statistician. That’s true for a lot of reasons, but it can start with simple issues of choices  made when coding missing values in a data set. Here are a few examples.
Researcher Joseph Tartaro thought it would be funny to get the following California vanity license plate: (more…)
A great way to get started with Stata is using its menus.
The first part of this Tutorial Series introduced you to Stata’s windows. You can now begin learning how to use Stata to work with data.
Across the top are 8 tabs: File, Edit, Data, Graphics, Statistics, User, Window, and Help.

We will not go through every option within the Stata menus. Instead, we’ll highlight a few options to get you started. In this article, we’ll start with three of the most useful menus: File, Data, and Help, along with those helpful icons under the menus.
In our next article, we’ll look at two more: Graphics and Statistics.
(more…)
 One of the hardest steps in any project is learning to ask the right research question!
(more…)