If you have significant a significant interaction effect and non-significant main effects, would you interpret the interaction effect?
It’s a question I get pretty often, and it’s a more straightforward answer than most.
First, it’s important to keep in mind the nature of statistical significance. The .05 threshold for p-values is arbitrary. p-values are a continuum and they depend on random sampling. So the significant/not significant divide doesn’t follow rules of logic. Rules like “if A < B and B < C, then A < C” don’t apply here.
So just because an effect is significant doesn’t mean it’s large or meaningfully different than 0.
It could be, but it doesn’t have to be.
So first off, with any effect, interaction or otherwise, check that the size of the effect is large enough to me scientifically meaningful, in addition to checking whether the p-value is low. It will require you to use your scientific knowledge.
So I’m going to use the term “significant and meaningful” here to indicate an effect that is both.
There is really only one situation possible in which an interaction is significant and meaningful, but the main effects are not: a cross-over interaction.
Unlike many terms in statistics, a cross-over interaction is exactly what it says: the means cross over each other in the different situations. Here’s an example of a two-by-two ANOVA with a cross-over interaction:
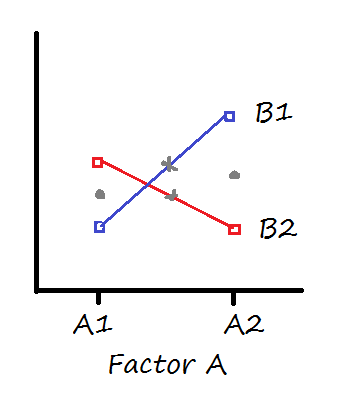
The two grey dots indicate the main effect means for Factor A. Their height is pretty much the same, so there would be no main effect for Factor A.
The two grey Xs indicate the main effect means for Factor B. Sure, the B1 mean is slightly higher than the B2 mean, but not by much. In most data sets, this difference would not be significant or meaningful.
But there clearly is an interaction. The difference in the B1 means is clearly different at A1 than it is at A2 (one difference is positive, the other negative).
So yes, you would would interpret this interaction and it is giving you meaningful information.
What does it mean? You’d say there is no overall effect of either Factor A or Factor B, but there is a crossover interaction. The effect of B on the dependent variable is opposite, depending on the value of Factor A.

What if I have one of the 2 independent variables and the interaction term(of the same 2 variables) are significant, and the other independent variable is insignificant. Is it possible to interpret the interaction term having one of the variables constituting the interaction term insignificant ?
Yes, this is really common.
I am running a two-way repeated measures ANOVA (main effects: Time, Condition). The result is that the main effect of time is significant (P0.05), and the interaction effect (time*condition) is significant (P<0.05).
Considering there is a significant interaction effect, we have ran Tukey post hoc testing to decompose the data points at each time and determine if differences exist. Although to my understanding this is acceptable, our approach has recently been questioned as an individual has suggested you need all main effects to be significant prior to further investigation into the significant interaction effect.
Does anyone have any thoughts/articles that may support/refute my approach. Kind regards,
That individual is misinformed. Was it Reviewer #2? 🙂
I’m not sure I have a good reference to refute it. It’s just basic understanding of these models. I can recommend some of my favorite ANOVA books: Keppel’s “Design and Analysis” and Montgomery’s “Design and Analysis of Experiments.”
I am running a multi-level model. I’m examining willingness to take risks for others and the self based on narcissism. Model 1 is simply Risk ~ Narcissism, Model 2 is Risk ~ Narcissism + Condition, Model 3 is Risk ~Narcissism+ Condition + Narcissism * Condition. Why would my model 2 estimates (Condition Other/Anonymous) be negative (-.9/-.7) while the same estimates show up in model 3 as positive (13.3/39.5) with the anonymous condition becoming significant (p < 0.05), along with the interaction estimates being negative in model 3 (-.17/-.49)? The mean risk score for the anonymous, and other conditions are around 32 and the mean score for the self condition (the comparison group) is around 33. Thanks for all you do!
Hey,
I don’t know if I just don’t see the answer but I also wonder about how to interpret the scenario:
interaction term significant main effect not main effects (without interaction term) both significant.
I not did simultaneous linear hypothesis for the two main effects and the interaction term together. Alternatively I thought about testing the linear hypothesis: “beta_main_1 + beta_main_2 + beta_interaction_main_1_2 =0”.
Are both options right or is one option to be preffered?
Best, Luise
Hi Luise,
Which approach to take depends on which hypothesis you want to test. Do you only care about the simultaneous hypothesis (any beta = 0)? Or do you want to test each main effect and the interaction separately?
Would this lead to dropping factor A and keeping the interaction term?
I’m dealing with a similar problem and I am seeing the adjusted R^2 increased (not by much -> .002) but variability in the interaction term increased from .1 -> .3
Hi Ruth,
As a general rule, if the interaction is in the model, you need to keep the main effects in as well. Otherwise you’re setting that main effect to = 0. Even if it’s not far from 0, it generally isn’t exactly 0.
Hi, so I have a question
I have a 2v3 ANOVA which the independent variables are gender and age and dependent variable is test score. But while looking at the results none of the results are significant, Further, I observed that females younger age performed worse that females older whereas males younger performed better than males older. However the interaction in plots cross over. What does the mean and how do I report it.
Hi Karen, what if you are using HLM and have a 2 Level variable that has no significant effect but when you interact it with a Level 1 variable the interaction effect is significant?
Hi Diana,
I’m not sure if you are referring to HLM, the software, or Hierarchical Linear Models (aka Multilevel or Mixed models) in general. I know the software requires you to specify whether each predictor is at level 1 or 2. Most other software doesn’t care. In any case, it works the same way as in a linear model.
My results are showing significant main effects, however, interaction is not significant. I am using PERMONOVA. How to interpret the main effects?
I would appreciate your inputs on it.
Thank you so much
Hi Karen,
I used mixed design ANOVA when analyzing my accuracy data and also my RT, some of the results were significant in the subject analysis but not in the item analysis. For example, I found a significant interaction between factor A and B in the subject analysis but not by item analysis, so how can I explain it? should I say there is no relation between factor A and factor B since it is not significant in the analysis by item. I am a little bit confused. I would appreciate it if you can help.
What if the main and the interaction variables insignificant, but I retained the interaction variable because it produced a lower Prob>chi2? How can I interpret that?
Dear Karen,
Could you tell me the year this post was created, I could not find a date in this page. I am going to use it as a reference in an academic paper, thank you.
Hi Anis,
I believe when you cite a web site, you simply put the date it was downloaded, as web content can be updated.
Hi Karen,
could you tell me what it would be the otherway round, so, the two main effects would be significant but the interaction is not? Would be very helpful for me to know!!!!!!!!!
Best Kate
Hi Anyone has any backup references ( research papers) that uses this term crossover interaction?
That would really help as I couldn’t find this type of interaction.
By the way Karen, Thanks a lot !
I found a textbook definition in Epidemiology, Beyond the Basics by Szklo and Nieto, 2014, starting on page 207. Section 6.7.1 Quantitative vs Qualitative Interaction.
This article included this synonym for “crossover” interactions — “qualitative” interactions. https://cdn1.sph.harvard.edu/wp-content/uploads/sites/603/2013/03/InteractionTutorial.pdf
This article had some examples that were similar to some of my findings https://www.unc.edu/courses/2008spring/psyc/270/001/interact.html#i9
Warm wishes to everyone. And thanks to Karen for writing this article so that it came up in my Google search.
Dear Karen, I have two independent variables and one dependent variable. At first, both independent variables explain the dependent variable significantly. However, when we add in the moderator, one independent become insignificant. Should I remove the insignificant independent variable? It seems to me, when I run regression using the whole data (n=232), both independent variables predict the dependent variable. When I use part of the data (n1= 161; n2=71) to run regression separately, one of the independent variable became insignificant for both partial data. How to explain it? Thank you very much.
Dear Karen, i have 3 dependent variables (attitude towards the Ad & Brand and purchase intentions) my independent variables is Endorser type( one typical endorser and 2 celebrity endorser), I ran two way manova to find out whether there is a significant Endorser type*Gender interaction, which was found to be not significant, but the TEST BETWEEN SUBJECT table is showing significant interaction effect for PI, please tell me how to present this result.
Thanks for explaining this. Is the same explanation apply to regression and path analysis? Also, is there any article that discuss this and is it possible to share the citation with us?
Currently I am doing My thesis under the title of the effect/impact of knowledge management on organizational performance.Unfortunatlly I am stack on the analysis phase. I use SPSS version 20.My Knowledge management has two elements i.e Knowledge enablers (Technology, Organizational Structure and organizational culture) and Knowledge process (knowledge creation, Application, sharing , acquisition). The organizational performance has 3 elements i.e Customer satisfaction, Learning and growth of employee and perceived performance of the organization. Now I have a total of 94 liker scale questionnaire (Strongly Disagree, disagree, neither agree nor disagree, agree and strongly agree) i.e Technology has 8 items, structure 5 items, culture has 8 items knowledge creation 12 items, knowledge application 7 items etc.Now My question is that how do I group and analyses all the Knowledge management (Knowledge enablers and knowledge process) items in one on SPSS (like correlation etc), And organizational performance items in one. Then how do correlate or identify the impact/effect of Knowledge management on organizational performance grouping all this items in one. The other problem is how to make validity and reliability of each group of items as a group and individually. Pls help me on these issues on SPSS 20.
Thank you In advance.
Hello, i have a question regarding interaction term as well..
My main variables are Governance(higher the better) and FDI.
and dependent variable is Human Development Index
In my case, only FDi is significant and postive, but Governance is not significant.
The problem is interaction term. it is negatively correlated with HDI.
Does it mean i have to interpret that FDI alone has positive impact on HDI,
but when it is executed in countries with good governance, it has negative impact on HDI? For me, it doesn’t make sense…
Dear Karen,
Could you please explain to me the follow findings:
my dependent variable is the educational achievements of the native students.
my independent variables are – the proportion of the immigrants at the school and the average parental education of the immigrants students.
I built the interaction between these two variables – the interaction was significant and the positive but the main effects were non-significant . how can I explain the results.
thanks a lot.
Svetlana
It means that the proportion of migrants is not associated with differences in the dependent variable. Similarly foe migrants’ parental education. However if in a school you have many migrants and and they have high parental education, than native students will be more educated.
As always, Karen, your explanation is clear and to-the-point!
Thanks, Jane!