Not too long ago, I was in Syracuse for a family trip to the zoo. Syracuse is about 60 miles from where I live and it has a very nice little zoo.
This year was particularly exciting because a Trader Joe’s just opened in Syracuse. We don’t have one where we live (sadly!) so we always stock up on our favorite specialty groceries when we’re near a Trader Joe’s.
On this particular trip, though, we had an unwelcome surprise. My credit card card company believed my Trader Joe’s spree was fraudulent and declined the transaction. I got a notice on my phone and was able to fix it right away, so it wasn’t the big inconvenience it could have been.
But this led us to wonder what it was about the transaction that led the bank to believe it was fraudulent. Do credit card thieves often skip town and go grocery shopping?
The bank was clearly betting so. It must have a model for aspects of a transaction that are likely enough to be fraudulent that it shuts it down.
With any model, though, you’re never going to to hit 100% accuracy. And if you’re wrong, there’s a tradeoff between tightening standards to catch the thieves and annoying your customers.
Measuring Accuracy of Model Predictions
There are many ways to measure how well a statistical model predicts a binary outcome. Three very common measures are accuracy, sensitivity, and specificity.
Accuracy is one of those rare terms in statistics that means just what we think it does, but sensitivity and specificity are a little more complicated. To understand all three, first we have to consider the situation of predicting a binary outcome.
The basic situation is this: for each trial (in our example, each transaction), there is only one true outcome: a Positive or a Negative. In my example, we’ll assume a Positive is a stolen credit card. That’s what the bank is on the lookout for.
And of course we need the model to predict the outcome better than randomly guessing. Imagine if your credit card transactions were randomly declined for fraud. You would stop using the card.
So here is a little table of all the possible situations:
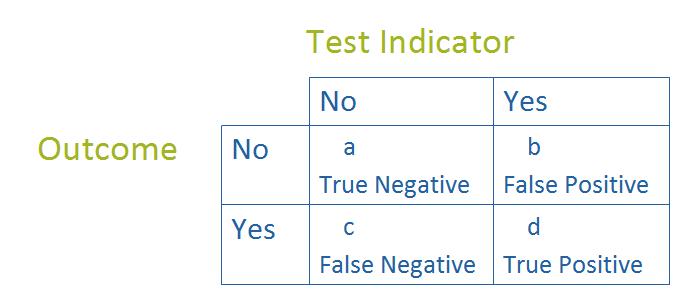
This table has the fancy name of a confusion matrix, but you can see that it’s pretty simple.
The Test Indicator is whatever process we’re using to predict whether each individual is a Yes or a No on the outcome we’re interested in. Does the bank’s model predict a thief?
The Outcome is what actually eventually happens. Was the card really stolen?
For some decisions, those in box a, the model correctly predicted a no. All good. This is a true negative. The customer is using their own card and the bank believes it. The transaction goes through and the family happily snacks on dried mango on the drive home.
Box b is the count of those who were predicted to be Yeses but were actual Nos. Not so good. False positive. The customer isn’t happy that their real grocery shopping gets declined. Only some quick followup on the phone saves them.
Box c is the opposite of b. Those who were predicted to be Nos but were actual Yeses. This one is not so good either. False negative. The thief gets away with a load of risotto and dark chocolate covered almonds.
And finally some transactions were predicted to be Yeses and truly were Yeses. These individuals are all in box d. The thief is shut down. Justice is served.
Accuracy of Models
A perfectly accurate model would put every transaction into boxes a and d. Thieves are stopped but customers are not.
A model that is so bad it’s worthless would have a lot of b’s (angry customers without groceries) and c’s (happy thieves with groceries) and possibly both.
One simple way of measuring Accuracy is simply the proportion of individuals who were correctly classified–the proportions of True Positives and True Negatives.
This is helpful for sure, but sometimes it matters whether we’re correctly getting a Positive or a Negative correct. It may be worth annoying a few customers to make sure no thieves get away.
Another issue is we can generally increase one simply by decreasing the other. This may have important implications but the overall Accuracy rate won’t change.
Or worse, we could improve overall Accuracy just by making the test more able to find the more common category.
So a better approach is to look at the accuracy for Positives and Negatives separately.
These two values are called Sensitivity and Specificity.
Sensitivity = d/(c+d): The proportion of observed positives that were predicted to be positive. In other words, of all the transactions that were truly fraudulent, what percentage did we find?
Specificity = a/(a+b): The proportion of observed negatives that were predicted to be negatives. In other words, of all the transactions that were legitimate, what percentage did we predict to be so?
Ideally, the test will result in both being high, but usually there is a tradeoff. Every test needs to pick a threshold for how high a probability of fraud has to be before we call it a fraud.
Lowering that threshold to increase Sensitivity will decrease Specificity and vice versa. It’s important to understand this as you’re choosing that threshold and evaluating a model.

Great way of explaining the concepts – clear and easy to understand!!
Ty very much for this very clear explanation. I have seen explanations of sensitivity and specificity, be all over the place in many articles.
very clear explanation . Trader Joe’s example is incredible. Kind of revises my concepts every time I go there 🙂 > I hope they open a new store in your neighborhood
Incredibly useful and logical explanation!
At last! A logical mind and a clear writer. This explanation (like so many others on the site) is incredibly useful.