Sometimes what is most tricky about understanding your regression output is knowing exactly what your software is presenting to you.
Here’s a great example of what looks like two completely different model results from SPSS and Stata that in reality, agree.
The Model
I ran a linear model regressing “physical composite score” on education and “mental composite score”.
The outcome variable, physical composite score, is a measurement of one’s physical well-being. The predictor “education” is categorical with four categories. The other predictor, mental composite score, is continuous and measures one’s mental well-being.
I am interested in determining whether the association between physical composite score and mental composite score is different among the four levels of education. To determine this I included an interaction between mental composite score and education.
The SPSS Regression Output
Here is the result of the regression using SPSS:
(more…)
In this follow-up to December’s webinar, we’ll finish up our discussion of interactions.
There is something about interactions that is incredibly confusing.
An interaction between two predictor variables means that one predictor variable affects a third variable differently at different values of the other predictor.
How you understand that interaction depends on many things, including:
- Whether one, or both, of the predictor variables is categorical or numerical
- How each of those variables is coded (specifically, whether each categorical variable is dummy or effect coded and whether numerical variables are centered)
- Whether it’s a two-way or three-way interaction
- Whether there is a directionality to the interaction (moderation) or not
Sometimes you need to get pretty sophisticated in your coding, in the output you ask for, and in writing out regression equations.
In this webinar, we’ll examine how to put together and break apart output to understand what your interaction is telling you.
Note: This training is an exclusive benefit to members of the Statistically Speaking Membership Program and part of the Stat’s Amore Trainings Series. Each Stat’s Amore Training is approximately 90 minutes long.
About the Instructor

Karen Grace-Martin helps statistics practitioners gain an intuitive understanding of how statistics is applied to real data in research studies.
She has guided and trained researchers through their statistical analysis for over 15 years as a statistical consultant at Cornell University and through The Analysis Factor. She has master’s degrees in both applied statistics and social psychology and is an expert in SPSS and SAS.
Not a Member Yet?
It’s never too early to set yourself up for successful analysis with support and training from expert statisticians.
Just head over and sign up for Statistically Speaking.
You'll get access to this training webinar, 130+ other stats trainings, a pathway to work through the trainings that you need — plus the expert guidance you need to build statistical skill with live Q&A sessions and an ask-a-mentor forum.
There is something about interactions that is incredibly confusing.
An interaction between two predictor variables means that one predictor variable affects a third variable differently at different values of the other predictor.
How you understand that interaction depends on many things, including:
- Whether one, or both, of the predictor variables is categorical or numerical
- How each of those variables is coded (specifically, whether each categorical variable is dummy or effect coded and whether numerical variables are centered)
- Whether it’s a two-way or three-way interaction
- Whether there is a directionality to the interaction (moderation) or not
Sometimes you need to get pretty sophisticated in your coding, in the output you ask for, and in writing out regression equations.
In this webinar, we’ll examine how to put together and break apart output to understand what your interaction is telling you.
Note: This training is an exclusive benefit to members of the Statistically Speaking Membership Program and part of the Stat’s Amore Trainings Series. Each Stat’s Amore Training is approximately 90 minutes long.
About the Instructor
Karen Grace-Martin helps statistics practitioners gain an intuitive understanding of how statistics is applied to real data in research studies.
She has guided and trained researchers through their statistical analysis for over 15 years as a statistical consultant at Cornell University and through The Analysis Factor. She has master’s degrees in both applied statistics and social psychology and is an expert in SPSS and SAS.
Not a Member Yet?
It’s never too early to set yourself up for successful analysis with support and training from expert statisticians.
Just head over and sign up for Statistically Speaking.
You'll get access to this training webinar, 130+ other stats trainings, a pathway to work through the trainings that you need — plus the expert guidance you need to build statistical skill with live Q&A sessions and an ask-a-mentor forum.
Yesterday I gave a little quiz about interpreting regression coefficients. Today I’m giving you the answers.
If you want to try it yourself before you see the answers, go here. (It’s truly little, but if you’re like me, you just cannot resist testing yourself).
True or False?
1. When you add an interaction to a regression model, you can still evaluate the main effects of the terms that make up the interaction, just like in ANOVA. (more…)
Regression models are just a subset of the General Linear Model, so you can use GLM procedures to run regressions. It is what I usually use.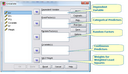
But in SPSS there are options available in the GLM and Regression procedures that aren’t available in the other. How do you decide when to use GLM and when to use Regression?
GLM has these options that Regression doesn’t: (more…)