I’m a big fan of Analysis of Variance (ANOVA). I use it all the time. I learn a lot from it. But sometimes it doesn’t test the hypothesis I need. In this article, we’ll explore a test that is used when you care about a specific comparison among means: Dunnett’s test.
The traditional ANOVA hypothesis
Recall the null hypothesis test for analysis of variance.
![]()
The null hypothesis specifies that every pair of means is equal. For four groups, this implies six equalities: 1=2, 1=3, 1=4, 2=3, 2=4, and 3=4. For six groups, you would have 15 equalities; for 10, you’d have 45.
It gets messy very fast. That’s okay. If you have a lot of groups that you are comparing, you have to make a lot of comparisons. Or do you?
The hypothesis that compares to a control group
If one of your groups is a control or placebo, AND you want only to compare each treatment to the control, this is what the hypothesis looks like, assuming that the control is group #1.
![]()
There’s a procedure for this, Dunnett’s test. It involves only three comparisons if you have four groups total, and only nine comparisons if you have ten groups total. You can quickly identify which treatments are different than the control. This also gives you simplicity and a bit of extra power and precision.
Dunnett’s test is easy to implement. Calculate the traditional measures in analysis of variance, including mean squared error (MSE). You can skip the F Test that you see in most ANOVA tables. It won’t hurt your overall alpha level, as long as you only look at each treatment versus the control.
Simply compare each treatment mean minus the control mean to a cutoff value using percentiles from a special table for Dunnett’s test. The critical value for Dunnett’s test depends on alpha (the desired Type I error rate for a two-sided test), g (the number of groups including the control group) and n (the number of data points in each group). Note that some tables define g as the number of groups excluding the control group.
Most statistical software packages will include Dunnett’s test as an option for ANOVA. Just remember that you don’t need to use the initial F test as a screen before jumping into Dunnett’s test.
An Example of Dunnett’s Test
Let’s look at an example* in an experiment examining the effect of different disinfection protocols on a piece of dental equipment, orthodontic elastormeric ligatures (think braces). In this experiment, 120 ligatures were divided into 6 groups of 20. Each group received a different disinfection protocol, with the exception of the first group, which received no disinfection. This group served as a control group.
Disinfection is important, but does it reduce the tensile strength of the ligatures? Here are the summary statistics for the maximum strength measurement.
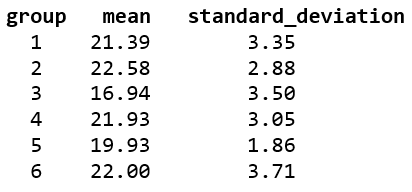
The paper does not include the raw data, but you can still calculate all the key statistics needed to run Dunnett’s test. You can then create a simple graph that identifies if any of the disinfection protocols shows significantly less strength than the control.
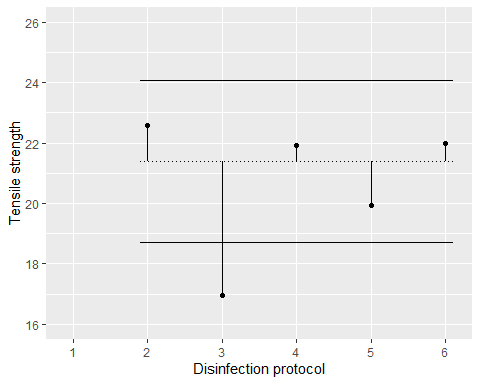
The dotted line is the mean for the control group. Any mean falling outside the solid lines is statistically significantly different from the control mean. Notice that there is no comparison at 1 because you don’t compare the control group to itself.
Only the third disinfection protocol has significantly less strength compared to the control group with no disinfection. This graph shows a two-sided comparison, but you may prefer a one-sided comparison. This is a very easy modification.
Caveats for using Dunnett’s Test
Things get a bit dicey when the group sizes are unequal. The formulas get a bit messier and the intervals are approximate. This is generally true for most approaches to handling multi-group data.
Keep in mind that you lose something when you simplify the hypothesis. Suppose you have six groups, a control and five different treatments. Now imagine that all of the treatments are significantly better than the control group.
Jackpot! Every treatment is worth further study. But Dunnett’s test won’t allow you to see if some of the treatments are better than the others. There is no option for finding the best of the best.
Let’s consider this as a reminder that there is no such thing as a free lunch. There are always trade-offs. No approach is superior in all settings. If, however, you are truly only interested in comparing each treatment to the control and you specify this prior to looking at the data, then Dunnett’s test is a very attractive option.
*Osorio LB et al. Disinfection of Orthodontic Elastomers and Its Effects on Tensile Strength. Turkish Journal of Orthodontics, 2021, 35(1): 22-26.
by Steve Simon, PhD

Leave a Reply