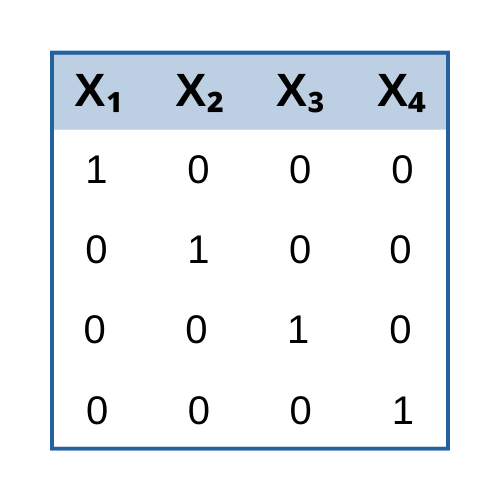
new blog post: Member Training: Dummy and Effect Coding
Previous Posts
All resampling techniques are based on the idea of repeatedly estimating a statistic based on subsets of the sample. There are many practical applications, including estimating standard errors when they can’t be based on a theoretical distribution (a.k.a., when distributional assumptions are not met).
You can re-code an entire vector or array at once. To illustrate, let’s set up a vector that has missing values.
Sometimes you need to know if your data set contains elements that meet some criterion or a particular set of criteria. For example, you may need to know if you have missing data (NAs) lurking somewhere in a large data set...
SPSS has the Count Values within Cases option, but R does not have an equivalent function. Here are two functions that you might find helpful, each of which counts values within cases inside a rectangular array...
Combining the length() and which() commands gives a handy method of counting elements that meet particular criteria...
Why We Needed a Random Sample of 6 numbers between 1 and 10000 As you may have read in one of our recent newsletters, this month The Analysis Factor hit two milestones: 10,000 subscribers to our mailing list 6 years in business. We’re quite happy about both, and seriously grateful to all members of our […]
Not too long ago, a client asked for help with using Spotlight Analysis to interpret an interaction in a regression model. Spotlight Analysis? I had never heard of it. As it turns out, it’s a (snazzy) new name for an old way of interpreting an interaction between a continuous and a categorical grouping variable in a regression model...
A central concept in statistics is level of measurement of variables. It's so important to everything you do with data that it's usually taught within the first week in every intro stats class. But even something so fundamental can be tricky once you start working with real data...
We continue with the same glm on the mtcars data set (regressing the vs variable on the weight and engine displacement). Now we want to plot our model, along with the observed data. Although we ran a model with multiple predictors, it can help interpretation to plot the predicted probability that vs=1 against each predictor separately. So first we fit
While parametric regression models like linear and logistic regression are still the mainstay of statistical modeling, they are not the only, nor always the best, approach to predicting outcome variables. Classification and Regression Trees (CART) are a nonparametric approach to using values of predictors to find good predictions of values of a response variable.
 stat skill-building compass