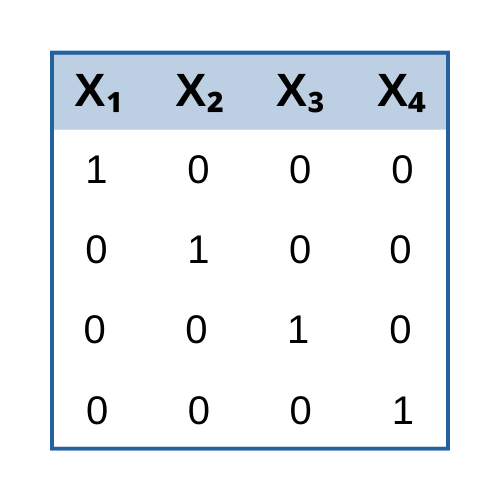
new blog post: Member Training: Dummy and Effect Coding
Previous Posts
Linear, Logistic, Tobit, Cox, Poisson, Zero Inflated… The list of regression models goes on and on before you even get to things like ANCOVA or Linear Mixed Models. In this webinar, we will explore types of regression models, how they differ, how they’re the same, and most importantly, when to use each one.
Have you ever been told you need to run a mixed (aka: multilevel) model and been thrown off by all the new vocabulary? It happened to me when I first started my statistical consulting job, oh so many years ago. I had learned mixed models in an ANOVA class, so I had a pretty good […]
This kind of situation happens all the time, in which a colleague, a reviewer, or a statistical consultant insists that you need to do the analysis differently. Sometimes they're right, but sometimes, as was true here, the two analyses answer different research questions.
Today we learn how to obtain useful diagnostic information about a regression model and then how to draw residuals on a plot.
The following is a TED talk by Arthur Benjamin, who is a math professor at Harvey Mudd College. Let me start by saying he is awesome. I already watched his Mathemagician TED talk with my kids*, so when I found this, I already expected it to be very good. I wasn't disappointed.
Have you starting using R? One secret to using any statistical software well and without frustration is learning the little “tricks” that make it easy to do the things you need to do. This is especially true in R, which is constantly being updated. In this webinar, R expert David Lillis will show you 10 […]
There are many designs with multiple observations in a cluster. Repeated measures data have multiple observations from the same subject. Randomized block studies have multiple plant measurements nested within a farm. An evaluation may have social workers clustered within an agency. Because of the clustering, there are a few issues that come up when conducting sample size calculations for multilevel models that don't usually come up when running calculations for simpler models.
One of the hardest things to determine when conducting a factor analysis is how many factors to settle on. Statistical programs provide a number of criteria to help with the selection.
In the last five posts I wrote about factors as latent variables, rotations, and variable and factor selection. Now I would like to address a question that the consultants at The Analysis Factor are frequently asked: what is the difference between a confirmatory and an exploratory factor analysis?
In Part 1 we installed R and used it to create a variable and summarize it using a few simple commands. Today let’s re-create that variable and also create a second variable, and see what we can do with them.
 stat skill-building compass