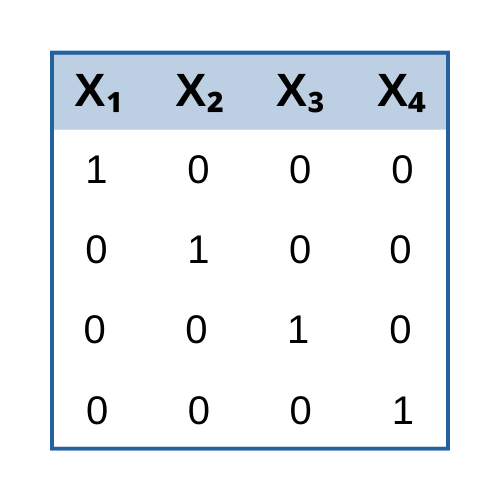
new blog post: Member Training: Dummy and Effect Coding
Previous Posts
Remember all those Z-scores you had to calculate in Intro Stats? Converting a variable to a Z-score is standardizing. In other words, do these steps for Y, your outcome variable, and every X, your predictors: 1. Calculate the mean and standard deviation.
This is especially true when your audience is a clinical one who needs to make decisions based on your results. So you're also absolutely correct that presenting a table full of odds ratios is not the way to go here. To answer your first question, no. You cannot say for every one female who fails, X number of males will fail. You can, however, convey the odds ratios in a concrete way through an example.
Every once in a while, I work with a client who is stuck between a particular statistical rock and hard place. It happens when they're trying to run an analysis of covariance (ANCOVA) model because they have a categorical independent variables and a continuous covariate. The problem arises when a coauthor, committee member, or reviewer insists that ANCOVA is inappropriate in this situation because one of the following ANCOVA assumptions are not met: (1) The independent variable and the covariate are independent of each other (2) There is no interaction between independent variable and the covariate.
When the response variable for a regression model is categorical, linear models don’t work. Logistic regression is one type of model that does, and it’s relatively straightforward for binary responses. When the response variable is not just categorical, but ordered categories, the model needs to be able to handle the multiple categories, and ideally, account for the ordering.
All statistical modeling–whether ANOVA, Multiple Regression, Poisson Regression, Multilevel Model–is about understanding the relationship between independent and dependent variables. The content differs, but as a data analyst, you need to follow the same 13 steps to complete your modeling. This webinar will give you an overview of these 13 steps: what they are why each […]
This post will focus on how the final factors are generated. An important feature of factor analysis is that the axes of the factors can be rotated within the multidimensional variable space. What does that mean?
Two methods for dealing with missing data,vast improvements over traditional approaches, have become available in mainstream statistical software in the last few years.
The key concept of factor analysis is that multiple observed variables have similar patterns of responses because of their association with an underlying latent variable, the factor, which cannot easily be measured. For example, people may respond similarly to questions about income, education, and occupation, which are all associated with the latent variable socioeconomic status.
Like some of the other terms in our list--level and beta--GLM has two different meanings. It's a little different than the others, though, because it's an abbreviation for two different terms: General Linear Model and Generalized Linear Model. It's extra confusing because their names are so similar on top of having the same abbreviation.
OK. Indeed, R has a longer learning curve than other systems, but don’t let that put you off! Once you master the syntax, you have control of an immensely powerful statistical tool. Actually, much of the syntax is not all that difficult. Don’t believe me? To prove it, let’s look at some syntax for providing summary statistics on a continuous variable.
 stat skill-building compass