Why use factor analysis?
Factor analysis is a useful tool for investigating variable relationships for complex concepts such as socioeconomic status, dietary patterns, or 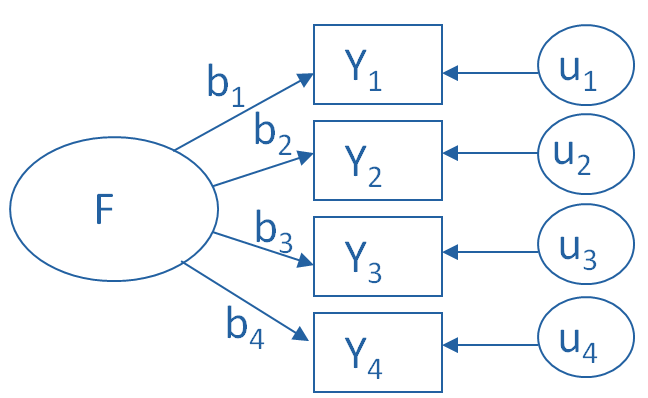 psychological scales.
It allows researchers to investigate concepts they cannot measure directly. It does this by using a large number of variables to esimate a few interpretable underlying factors.
What is a factor?
The key concept of factor analysis is that multiple observed variables have similar patterns of responses because they are all associated with a latent variable (i.e. not directly measured).
For example, people may respond similarly to questions about income, education, and occupation, which are all associated with the latent variable socioeconomic status.
In every factor analysis, there are one fewer factors than there are variables. Each factor captures a certain amount of the overall variance in the observed variables, and the factors are always listed in order of how much variation they explain.
The eigenvalue is a measure of how much of the common variance of the observed variables a factor explains. Any factor with an eigenvalue ≥1 explains more variance than a single observed variable.
So if the factor for socioeconomic status had an eigenvalue of 2.3 it would explain as much variance as 2.3 of the three variables. This factor, which captures most of the variance in those three variables, could then be used in other analyses.
The factors that explain the least amount of variance are generally discarded. Deciding how many factors are useful to retain will be the subject of another post.
What are factor loadings?
The factor loadings express the relationship of each variable to the underlying factor. Here is an example of the output of a simple factor analysis looking at indicators of wealth, with just six variables and two resulting factors.
| Variables | Factor 1 | Factor 2 |
| Income | 0.65 | 0.11 |
| Education | 0.59 | 0.25 |
| Occupation | 0.48 | 0.19 |
| House value | 0.38 | 0.60 |
| Number of public parks in neighborhood | 0.13 | 0.57 |
| Number of violent crimes per year in neighborhood | 0.23 | 0.55 |
The variable with the strongest association to the underlying latent variable. Factor 1, is income, with a factor loading of 0.65.
Since factor loadings can be interpreted like standardized regression coefficients, one could also say that the variable income has a correlation of 0.65 with Factor 1. Most research fields consider this a strong association for a factor analysis.
Two other variables, education and occupation, are also associated with Factor 1. Based on the variables loading highly onto Factor 1, we could call it “Individual socioeconomic status.”
House value, number of public parks, and number of violent crimes per year, however, have high factor loadings on the other factor, Factor 2. They seem to indicate the overall wealth within the neighborhood, so we may want to call Factor 2 “Neighborhood socioeconomic status.”
Notice that the variable house value also is marginally important in Factor 1 (loading = 0.38). This makes sense, since the value of a person’s house should be associated with his or her income.
About the Author: Maike Rahn is a health scientist with a strong background in data analysis. Maike has a Ph.D. in Nutrition from Cornell University.

It has helped a lot.
This is a good presentation
this is what i was searching. the interpretation.
Thanks for posting the best information and the blog is very informative seku.
Nice explanation thanks for the good work
Explained nicely. Now the meaning of factor loading is clear. But, there is still a confusion. What is eigen value. If eigen value is greater than 1, so what does it mean???
Thank you so much for my first understanding on FA
Very nice presentation. I have two questions: 1)on the SPSS output which of the analyses do you prefer-component, pattern or structure? and 2)how do you interpret negative sign loadings? Thanks so much. Tiffany
Hi,
I am still confused about the factor analysis. If have 6 factors in my analysis table, is it necessary to reduce it to say only 2 factors only?
Thanks
Thank you sir for this explanation.my question here can I add principal component analysis and factor analysis to make an analysis?
Dear, In my study,l have selected some municipalities with their different indicators viz. Demographic, education, amenities, health. Here,my quarries is -by which analysis I am going to confirm that the situation of this or that municipality are good or bad. Pls reply.
Helpful thank you for help
please help me
how many variables minimum we need to run factor analysis? I saw some researchers use at least 15. Is it the rule of thumb?
I have 3 varible and for evry vaible 150 observation
can I use factor analysis?
Well Explained, I found it very helpful and useful as described in the easiest way to understand it.
Thank u.
Very clear example and useful coverage to the FA concept
Dear Mr Rahn,
I would like to ask for your piece of advice on the following questions in relation to factor analysis:
1) How do you decide how many factors should be extracted? For instance, I have 44 variables in my survey and data is mainly categorical.
2) Do you conduct the factor analysis for all of variables at once or it is best to first prepare a bunch of variables and conduct the analysis. In my case, should I make like for instance 4 bunches of 11 variables and on a separate case run the factor analysis for each of the bunches. Does this mean that I should in advance make a descriptive statistic for each variable?
3) Once conducting a principle factor analysis for all variables, I see that the highest correlations have value 0,252 or 0,314 (in the correlation matrix). Does this mean that the model is insignificant?
Thank you in advance for your kind guidance.
Kind regards,
Mariya Zheleva
PhD student at Sofia University “St. Kliment Ohridski”, Bulgaria and at UVSQ in Paris, France
can someone respond to this question please.
I am facing the same problem
Easy to understand. thank you.
Really nice summary!
Precise and comprehensive!
Much appreciated,
easy to understand.thks
Clear, precise, simple to understand!
Thank you.
Hi, how are the factors obtained?
How you get factor 1 and Factor 2 ??
You are happy evening
I would like to ask you about your effective position on whether it is possible to use counting variables with factor analysis
thanks
Best wishes from IRAQ
Atheer,
It’s possible. The assumption is that all variables are normally distributed. Count variables are often skewed, but not always. So check your distributions.
Dear Maike,
thank you so much for your clear and useful explanation. I totally understand how to apply it well.
Best wishes from Germany
Thank you. It was easy to understand.
thanks a lot for the information
The article states “In every factor analysis, there are the same number of factors as there are variables”. However the table used in the example shows 6 variables and 2 factors. Why are the two numbers not equal? Does “variable” have different meanings in the statement and the table?
Thanks in advance for any clarification.
Mark,
Because although there are as many factors as variables, they aren’t all useful. So part of the job of the data analyst is to decide how many factors are useful and therefore retained.
This is a clear and straight forward explanation.
This clear and straight forward explanation.
Thank you
Thank you for the clear explanation!
Thanks for the simplicity and clear info 🙂
Thanks. It was explained very well.
Thank you
It is a well written article. If I understood correctly, we may use many questionnaire to assess some construct like Motivation. For this, I may include questions related to Work environment, Supervisor relationship, pay and other benefits, job satisfaction, training facilities etc., So there are five subcategories under which I have framed the questions. A factor analysis, if done properly should result at least in five factors. So, a factor analysis tries to stratify the questions included in the survey to homogeneous sub groups. Whether my understanding is correct?
commendable . best explanation so far
so if i understood it well, the FA can be used to analyse a data on “barroriers” to effective communication. That is when i have about 20 factors of the barriers to analyse. Thank you
God Bless you. it was an interesting, simple and understandable. it was well written and to the point. helped me a lot
Thanks for your contribution of FA. It’s is helping but need a hypothesis to support it
Dr Maike Rahn, Thanks so much for the short explanation of what factor analysis is all about. I fully understand how to apply. I wish one day you read my piece of work.
Kindest regards from Queenstown in Eastern Cape-South Africa
Hey, could you please name 4 psychological tests based on factor analysis, such as 16 PF and NEO, any other tests that you have come across?
Thanks.
I have read several articles trying to explain factor analysis. This one is the easiest to understand because it is clear and concise.
Hi,
Is it safe to say that factor analysis is the the analysis done in seeking the relationship of demographic and the variables (dependent, mediator, moderator) in the study? or Or is it the analysis done on every items under a construct? to see the loading among the items that represent the construct.
Do help me as I still cant figure out what factor analysis is. Kindly assist. Many thanks.
Mike
Hi Mike,
No, FA isn’t done to seek relationship between different variables in a relationship model.
Factor Analysis is a measurement model for an unmeasured variable (a construct). So it’s closer to your latter definition.
Thank you very much!
The clearest explanation I ever read.
Regards from Spain.
Thank you very much. I fully understand how to apply it.
Thank you for easier explanation. It definitely will helpful for my next step of data analysis.
Excellent description, very helpful to build understanding of the topic.
Explained in the simplest way even a lay man can understand. Thanks a bunch.
Simple and very clear explanation. It’s very clear for me now. Thank you.
Thaks sir,
Very nice explained, as simple as lay mans language
I wish everything had such an easy to understand definition! Thank you
Very crisp, clear and concise explanation. Thanks a ton.
have been through many documents about factor analysis, yours is the most clear explanation. Thanks big time
this is the best explanation that i have understand, keep on the standard Dr,,
I like it. kudos!
Very nice explanation of factor analysis. Keep up the nice work. A small request to you sir – please start small regular tutorials on statistics & data analysis.
Just adding my thanks to the list so you keep the posts coming!
OMG !
As I have searched many of websites for factor analysis. This was the best and easiest explanation i found yet.
Really helpful ! Great attempt ! Keep on doing social service !
that is very nice explanation.
you are so wonderful
Very lucid introduction on factors which would be useful to any novice to FA.
Thank you
Simple but valuable explanation. Thanks.
Thank you for your clear explanation of factor loading!
thanks for the introduction on factor analysis
Excellent explanation of the basics,
in my language there is a saying ( around 2000 years old) “Good teachings should have the quality of mothers milk,being good ,simple,digestable and sustaining) and I feel I have found it for Factor analysis.
Keep up the good work!
Explained in one of the best ways possible!!! Helps you understand by just reading it once (quite the contrary for the definitions on the other websites)
Hi Maike,
I have a survey with 15 q, 3 measure reading ability, 3 writing, 3 understanding, 3 measure monetary values and 3 measure literacy unrelated aspects.
I am confused
do I pick the read, write and understanding on the SPSS for factor analysis? how about the literacy unrelated q which are controls?
Thanks for your help.
Sat
Very simple and straight forward…Thanx
Very clear explanation and useful examples. Thanks. I woudl liek to aks you somehting. I have a questionnaire of 52 items (I used it for Pilot Sutdy)and I have done FA obtaining 1O factors after reduction. I need to reduce the number of questions since 52 is too much and leave the most ‘powerful’ can I use the FA analysis to reduce the number of questions? Thank you
I would like to design a questionnaire using Likert scale that I can use for factor analysis. my challenge is should I mix positive statements and negative statements in my compilation of the questionnaire? e.g. Let us say I need to find out the view of a student if they have a negative attitude towards learning a subject. Should I say in my questionnaire, “I have a negative attitude towards Mathematics.” or I do not have a negative attitude towards Mathematics.”
A very good work, thank you sir.
It seems to me you have mixed up the difference between factor analysis and PCA (Principal Component Analysis).
Where you talked about the amount of variance a factor captures and eigenvalue that measures that. it is principal components in PCA that tells you that because each principal component is orthogonal to the others and associated with an eigen-vector with a corresponding eigenvalue.
If not please let me know how eigenvalues of factors are calculated in factor anlysis
Very simple and nice explainations
Well done
Thanks Doc
This has been the most understandable explanation I have so far had. You mentioned something about your next post? about determination of number of factors. May you please also talk about factor analysis using R.
Dear Dr.
Good day to you. I have a question on factor analysis. I have a pool of 30 items for my construct, then I conducted the PCs, with nine items. After conducted the CFA, it only has three items. Does this acceptable ? Thank you.
Fantastic explanation!! Thank you
I have two kinds of questions: one with a 5-option response and another with a 7-option one. Can I run exploratory FA on both at the same time? When I run them with SPSS it lead to 8 factors that can explain 61% of the variance. But, mathematically, is it right?
Hi Rahn,
Great Job.!!!
How am I suppose to put citations to your web site?
FACTOR ANALYSIS IS VERY USEFUL METHOD FOR ANALYSING SCIENTIFIC DATA PARTICULARLY FOR DATA RELATING TO BIOTECH AND FOOD TECNOLOGY AND ANIMAL BEHAVIOUR
ALSO;Principal component analysis and exploratory factor analysis are both data reduction techniques — techniques to combine a group of correlated variables into fewer variables. You can then use those combination variables — indices or subscales — in other analyses.
Dear sir,
I am a new research student please help me about ”Comparatively study on data reduction method between factor analysis and principal component analysis”. Kindly guide me about this I will waiting for your answer.
I am grateful to have little idea on how to apply factor analysis. But stil sir! How would I enter data on exel spreat sheet and how will I start running the analysis? I am ph.D student and one of my objective of the study has to do with factor analysis. I have identify four factors with twenty three variable in question. Pls explain step by step for me. Thanks and best regard. Looking forward to hear from you sir.
Good stuff
Thank you very much Dr. Rahn. I have struggled 13 months to understand Factor Analysis, and this has been the simple and very helpful. Thank you again.
Dear Dr Thanks very much for you explanation on factor analysis, even those who beginners in statistics like me can follow your elaborations. its so illuminating. have gone through several text on factor analysis but could hardly capture the concept,
Thanks
As i am using Factor analysis by SPSS in my master research, i got five factors related to my research. At the end of the results by spss there is a 5*5 matrix ( 5 are the factors ). What does this matrix endicated for? in the beginning i thought it is a correlation matrix of the factors, but then i’ve been told no it isn’t ( without giving me what it is exactly). Can you help please?
p.s ; welcome to everybodys’ answer.
Thank you.
This was simple and clear with commonsense.
very usefull an understandable explanation.saved lit if time bcoz if this easy explationation..thank you…sir mikhe…
Thanks a lot this made my life a lot easier in the PHD
Thanks again!!
Dr. Rahn- I’ve been trying all afternoon to understand a research article that used this method and this was the first explanation that has helped me. Thank you very much for posting it!
Thanks, this was great. simple and to the point. many thanks.
Dear Dr.
very simple and informative.
thanks
the first one is correct. the Factor is a linear combination of the original variable. Hence, your first formula, represents the required info.
Dear Dr. Rahn,
I would like to hear your opinion if this method is valid:
I have used a PLS model and created an ‘factor’ (lets called it “Loyalty”). To make that factor I’ve used four variables and the factor loadings are the following:
s1 factorloading: 0,934
s2 factorloading: 0,886
s3 factorloading: 0,913
s4 factorloading: 0,937
Next I would like to estimate the loyalty of a respondent, who has the following values:
s1 = 3
s2 = 4
s3 = 4
s4 = 2
How can I emerge these values to one value and group each respondent into e.g. two groups (e.g. high loyalty, low loyalty)
I have an idea:
I use this formular:
Sum of (factorloading (si) * values(si))
(0.934 * 3) + (0.886 * 4) + (0.913 * 4) * (0.937 * 2) = 11.872
or maybe this formular:
Sum of (factorloadings(si) / (sum of factorloadings(s1,s2,s3,s4)) * values(si)
((0.934/(0.934+0.886+0.913+0.937)) * 3) + ((0.886/ (0.934+0.886+0.913+0.937)) * 4 + ((0.913 * (0.934+0.886+0.913+0.937)) * 4 + ((0.937 * (0.934+0.886+0.913+0.937)) * 2) = 3.23
Using this formular in this example would give the respondent a value of:
which formular is the right one (if any), and if either of them are the right one, what is?
thanks
p.s. Anyone is welcome to answer this question 🙂
Very clear and useful description, also understandable for non-mathematicians, e.g. linguists. Many thanks for posting this!
Hello Dr. Rahn
This was the best and and easiest to understand explanation of Factor Analysis I have found. I will book mark your page as a future reference. Thanks
Clint