The first real data set I ever analyzed was from my senior honors thesis as an undergraduate psychology major. I had taken both intro stats and an ANOVA class, and I applied all my new skills with gusto, analyzing every which way.
It wasn’t too many years into graduate school that I realized that these data analyses were a bit haphazard. (Okay, a LOT). And honestly, not at all well thought out.
A few decades of data analysis experience later, I realized that’s just a symptom of being an inexperienced data analyst.
But even experienced data analysts can get off track. It’s especially easy with large data sets with many variables. It’s just so tempting to try one thing, then another, and pretty soon you’ve spent weeks getting nowhere. (more…)
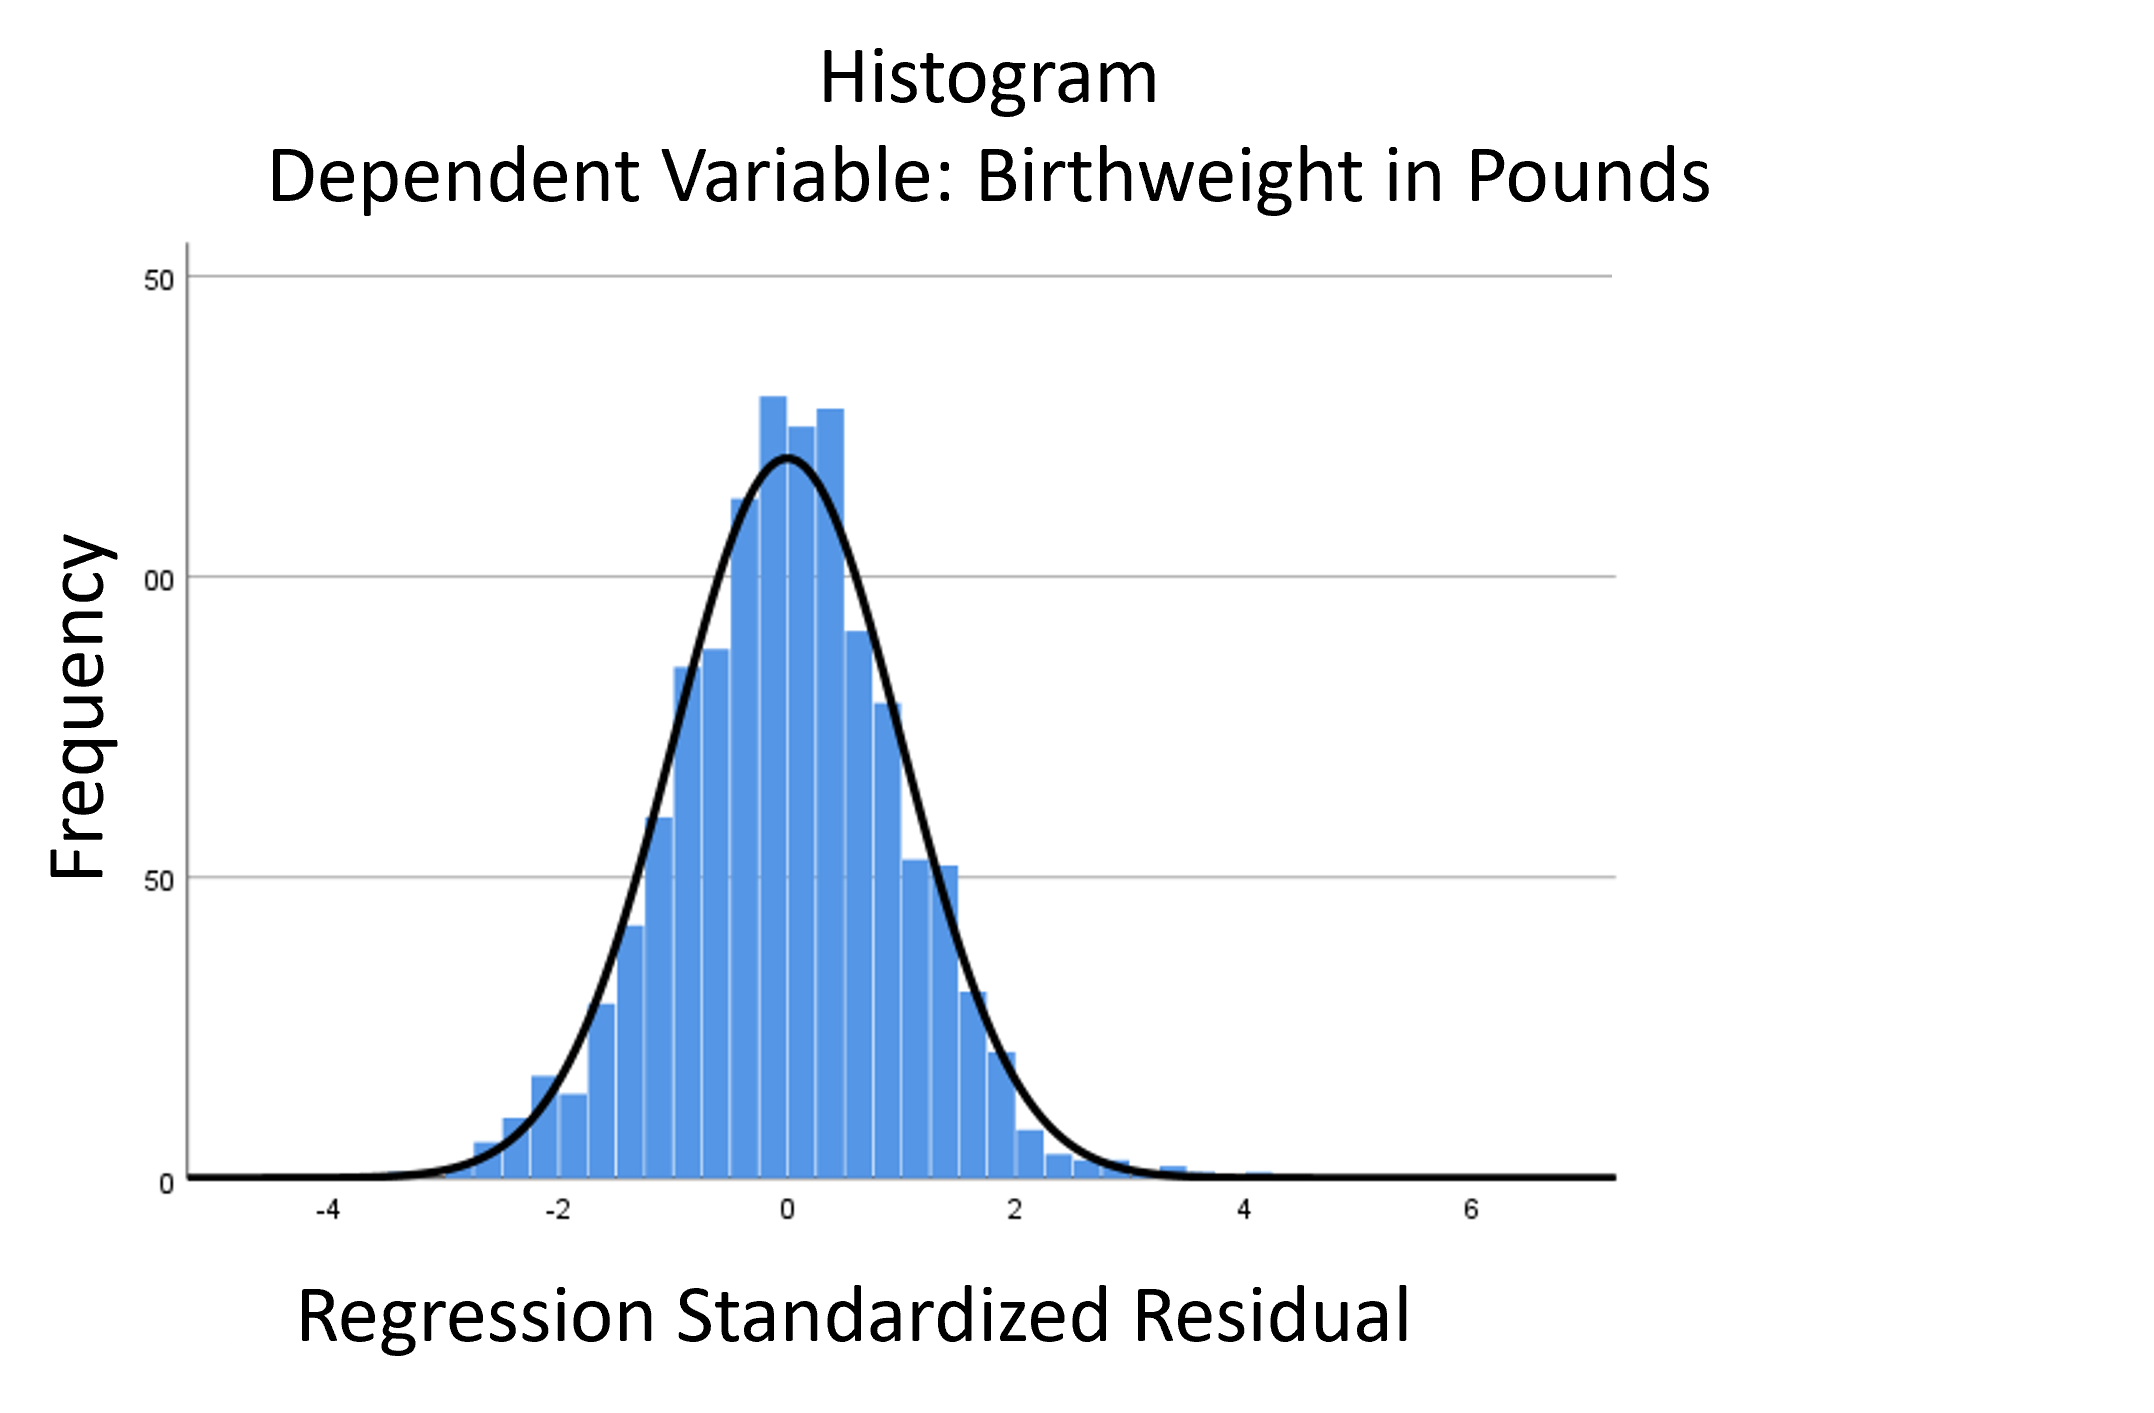
The linear model normality assumption, along with constant variance assumption, is quite robust to departures. That means that even if the  assumptions aren’t met perfectly, the resulting p-values and confidence intervals will still be reasonable estimates.
This is great because it gives you a bit of leeway to run linear models, which are intuitive and (relatively) straightforward. This is true for both linear regression and ANOVA.
You do need to check the assumptions anyway, though. You can’t just claim robustness and not check. Why? Because some departures are so far off that the p-values and confidence intervals become inaccurate. And in many cases there are remedial measures you can take to turn non-normal residuals into normal ones.
But sometimes you can’t.
Sometimes it’s because the dependent variable just isn’t appropriate for a linear model. The (more…)
 When analyzing longitudinal data, do you use regression or structural equation based approaches? There are many types of longitudinal data and different approaches to analyzing them. Two popular approaches are a regression based approach and a structural equation modeling based approach.
(more…)
The objective for quasi-experimental designs is to establish cause and effect relationships between the dependent and independent variables. However, they have one big challenge in achieving this objective: lack of an established control group.
(more…)
There are not a lot of statistical methods designed just to analyze ordinal variables.
But that doesn’t mean that you’re stuck with few options. There are more than you’d think.
Some are better than others, but it depends on the situation and research questions.
Here are five options when your dependent variable is ordinal.
(more…)
When you learned analysis of variance (ANOVA), it’s likely that the emphasis was on the ANOVA table, with its Sums of Squares and F tests, followed by a post-hoc test. But ANOVA is quite flexible in how it can compare means. A large part of that flexibility comes from its ability to perform many types of statistical contrast.
That F test can tell you if there is evidence your categories are different from each other, which is a start. It is, however, only a start. Once you know at least some categories’ means are different, your next question is “How are they different?” This is what a statistical contrast can tell you.
What is a Statistical Contrast?
A statistical contrast is a comparison of a combination of the means of two or more categories. In practice, they are usually performed as a follow up to the ANOVA F test. Most statistical programs include contrasts as an optional part of ANOVA analysis. (more…)