A key part of the output in any linear model is the ANOVA table. It has many names in different software procedures, but every regression or ANOVA model has a table with Sums of Squares, degrees of freedom, mean squares, and F tests. Many of us were trained to skip over this table, but
it has quite a bit of useful information if you understand what it means. In this article, we’re going to focus on explaining the Sums of Squares.
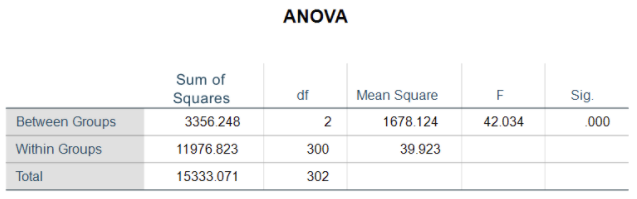
Here is the output of a one-way ANOVA with weight as the response, Y, and body frame as the categorical predictor, X. There are three categories of body frames: small, medium and large.
Total Sum of Squares
The “Total” Sum of Squares is a measurement of the dependent variable’s variation. It’s the numerator of the variance of Y. To calculate the total sum of squares: sum the squared differences between every value of Y and the mean of Y. This mean of Y is called the Grand Mean.
That’s a real mouthful, but it’s simply measuring how far each individual Y value is from its mean, then squaring it and adding them all up. The bigger that sum, the farther apart the Y values are.
Our interest in the total sum of squares is not its actual value. If we had measured everyone in kilos or stones the mean and variance would change. But the overall model results would not because the relationship of mean to variance would be consistent across the various scales used to determine everyone’s weight.
Our interest is in splitting that total sums of squares into two parts: the variation between group means and the variation around group means, within each group. We then use those sums of squares to calculate variances, then examine the ratio of the between group variance to the within group variance.
As the ratio of between to within group variance increases, the difference in the mean of one group to another group expands. The purpose of running an ANOVA is to determine whether there is a difference among the means of the different groups.
Between Groups Sums of Squares
The first step for determining whether there is a difference between groups is to calculate the “between groups” sum of squares. This sums of squares works the same way: we sum the square of a set of distances.
But this time, we’re not interested in the overall distances among points, we’re interested in the distances among group means. We start with the difference between a group mean and the grand mean. We do this for each group.
The sum of each group’s squared distance is the “between groups” sum of squares. The larger this is, the farther each group’s mean is from the grand mean. If it’s zero, every group has the same mean.
Within Groups/Error/Residual Sums of Squares
To calculate the within group sum of squares we take the difference between the total sum of squares and the between sum of squares.
The F test statistic
To get a p-value, we need to generate the test statistic. This is an F statistic, often called the F-ratio . The F ratio is a ratio of two variances. Each sum of squares is divided by its corresponding degrees of freedom to calculate these variances. These are called Mean Squares.
In our example above the between group mean square divided by the within group mean square is 42.034. To calculate the p-value the software uses the F-ratio value and the degrees of freedom for both the between and within variances. In the model above there is a statistical difference in expected mean weight between body frames. We can state the “main” effect of body frame is significant.
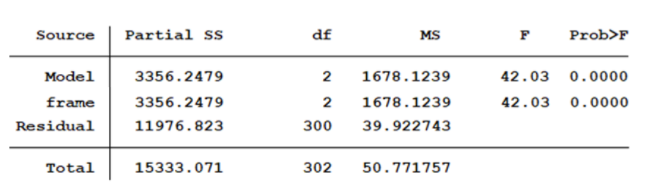
Be aware that different software packages use different names to describe the different parts of the table. In fact, the same software can use different names in different commands.
This is the same output from Stata’s ANOVA command.
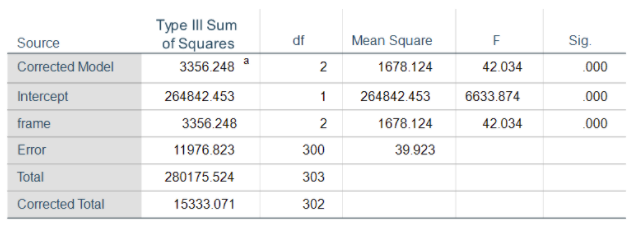
And again using SPSS’ UNIANOVA command:
Regardless of what you call it, understanding the Sums of Squares is super useful, especially as you start to build into more complex models.
Jeff Meyer is a statistical consultant with The Analysis Factor, a stats mentor for Statistically Speaking membership, and a workshop instructor. Read more about Jeff here.
Great practical work on the sums of squares. However when do you conclude that the hypothesis is rejected if you are using the F-ratio?
Thank you very much
I use SAS, and the SPSS UNIANOVA command has an “intercept” term that I’d only expect in a regression procedure. Is this term the same as the “correction factor” we once used when performing an ANOVA without software?
SPSS UNIANOVA can be used for either regression or ANOVA, despite the name. It’s equivalent to SAS’s proc glm.
It’s been a while since I did an ANOVA without software, but I don’t think it’s the same. It’s the mean when all X = 0. So in a true ANOVA, this intercept would be the Grand Mean.
Hi Jeff Meyer,
Thanks for your post about the “What are Sums of Squares?”
You mentioned one type of effect (the main effect): “We can state the “main” effect of body frame is significant.” Can you elaborate a bit on the meaning of “main”? It almost implies there are “secondary” or “not main” effects. Why is it the “main effect” and it being the main one, what other “types” of effects are there of importance for the analysis? That is, what other types of effects one can talk about in this analysis.
The Wikipedia article on “Main effect” nicely describes what main effect is. It is the effect of a single, independent variable on the response or dependent variable. The other type of effect you want to look for is an “interaction”.
The information was quite useful information. Pls. would you kindly explain the notation “P>F”, that is the significance? why you write P>F?
David, I understand that “P>F” in a SAS Anova (or “Prob>F” in Stata) is short for the “probability that a random F-value could be greater than the F-value that you found”, given the numerator and denominator degrees of freedom. It essentially means the same as “sig” or “significance level”