When you learned analysis of variance (ANOVA), it’s likely that the emphasis was on the ANOVA table, with its Sums of Squares and F tests, followed by a post-hoc test. But ANOVA is quite flexible in how it can compare means. A large part of that flexibility comes from its ability to perform many types of statistical contrast.
That F test can tell you if there is evidence your categories are different from each other, which is a start. It is, however, only a start. Once you know at least some categories’ means are different, your next question is “How are they different?” This is what a statistical contrast can tell you.
What is a Statistical Contrast?
A statistical contrast is a comparison of a combination of the means of two or more categories. In practice, they are usually performed as a follow up to the ANOVA F test. Most statistical programs include contrasts as an optional part of ANOVA analysis.
The way to write a contrast as a formula is
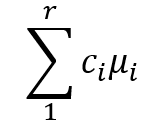
This seems a little abstract right now, so let’s look at an example. Suppose a researcher wants to learn how sunlight filters through a tree canopy. They want to learn how much light is received at different heights within a tree. They set light sensors at four different levels in sample trees: top, middle, lower, and ground.
ANOVA indicates there are differences in the mean brightness at these different levels. We would now like to learn which locations are brighter than others. An easy comparison might be comparing the middle and lower portions of the tree:
The only additional rule for statistical contrasts is that all of the ci must add up to 0.
Here’s one more example that is a little more complicated. Suppose we want to test instead whether the top level differs from all of the lower levels. We could use the contrast
Software can calculate standard errors and confidence intervals for these differences. It can also calculate p values. Let’s take a look at six types of contrasts that are commonly included in statistical software.
Pairwise
Pairwise contrasts are very common when the categories are equally important. These compare every category’s mean to every other category’s mean. In the canopy sunlight example, this would compare ground to lower, then to middle, then to top; then lower to middle and top; then middle to top. It would allow you to identify any differences that exist between categories.
Deviation
Deviation contrasts compare each level to the overall mean. In the canopy sunlight example, you would be able to identify which locations were significantly brighter or less bright than average.
Simple (Treatment v. Control)
Simple contrasts compare a control category to all other categories. Suppose that in the canopy sunlight example, current practice is to place light sensors at the top of a tree. Top would then be a control category. Simple contrasts would compare it to all the other categories. You could determine which levels are different from current practice.
Helmert/Reverse Helmert
When your categories have an order to them that may be related to the outcome, you may use Helmert contrasts. These compare each category to the combination of categories that follow.
In the canopy sunlight example, suppose we consider the levels to be ordered by height. Helmert contrasts would compare the ground to the average of lower, middle, and top; lower to the average of middle and top; and middle to top. (Reverse Helmert contrasts are similar, but would go from top down to ground.)
Repeated
You may also use repeated contrasts if the categories have an order to them. These compare each category to the one category that follows. In the canopy sunlight example, these would compare ground to lower, lower to middle, and middle to top.
Polynomial
You may also use polynomial contrasts if the categories have an order to them. These examine trends in outcomes. To help understand them, consider the canopy sunlight example.
- A linear trend would mean that the average brightness either increases or decreases as the level of the sensor moves higher in the tree.
- A quadratic trend would mean that the average brightness is either higher in the middle and lower at the ends of the tree, or lower in the middle and higher at the ends of the tree.
- A cubic trend would mean that whether the brightness is high or low changes with each level as you go up the tree.
Polynomial contrasts test these trends in sequence. The number of potential trends is one fewer than the number of categories.
Custom Contrasts
The types of statistical contrast outlined here are often built into your statistical software because they’re common patterns of means researchers want to compare. But your software will also have a way to input your own custom contrast by specifying the contrast coefficients yourself.
Leave a Reply