When you learned analysis of variance (ANOVA), it’s likely that the emphasis was on the ANOVA table, with its Sums of Squares and F tests, followed by a post-hoc test. But ANOVA is quite flexible in how it can compare means. A large part of that flexibility comes from its ability to perform many types of statistical contrast.
That F test can tell you if there is evidence your categories are different from each other, which is a start. It is, however, only a start. Once you know at least some categories’ means are different, your next question is “How are they different?” This is what a statistical contrast can tell you.
What is a Statistical Contrast?
A statistical contrast is a comparison of a combination of the means of two or more categories. In practice, they are usually performed as a follow up to the ANOVA F test. Most statistical programs include contrasts as an optional part of ANOVA analysis. (more…)
One of the many decisions you have to make when model building is which form each predictor variable should take. One specific version of this decision is whether to combine categories of a categorical predictor.
The greater the number of parameter estimates in a model the greater the number of observations that are needed to keep power constant. The parameter estimates in a linear (more…)
At times it is necessary to convert a continuous predictor into a categorical predictor. For example, income per household is shown below.
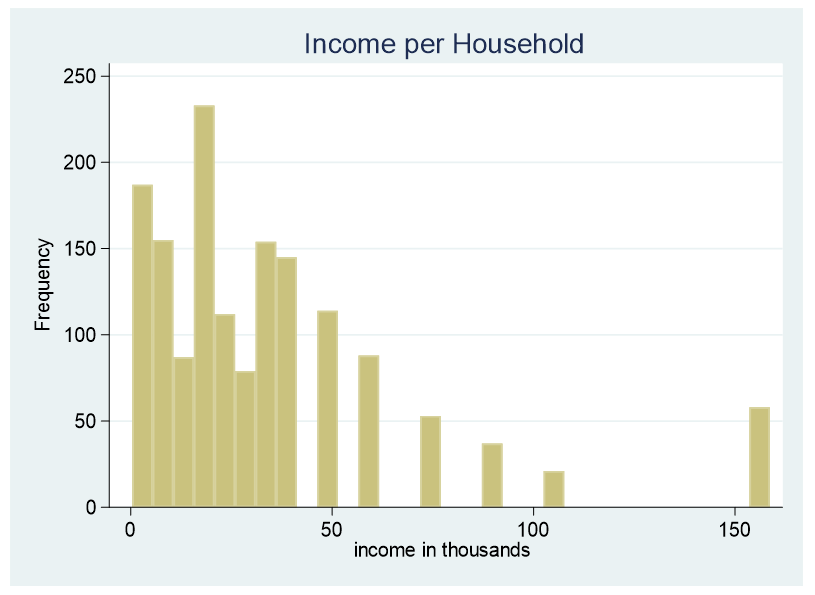
This data is censored, all family income above $155,000 is stated as $155,000. A further explanation about censored and truncated data can be found here. It would be incorrect to use this variable as a continuous predictor due to its censoring.
(more…)
In a previous post we discussed using marginal means to explain an interaction to a non-statistical audience. The output from a linear regression model can be a bit confusing. This is the model that was shown.
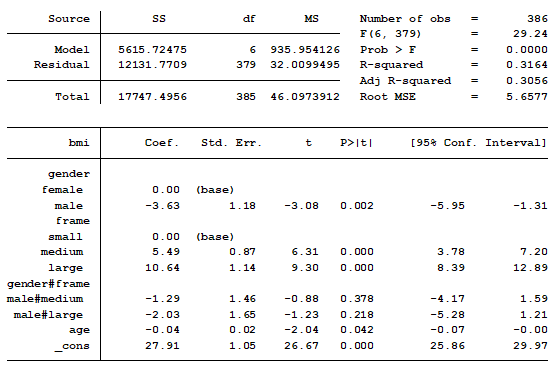
In this model, BMI is the outcome variable and there are three predictors:
(more…)