• Skip to primary navigation
  • Skip to main content
  • Skip to primary sidebar
The Analysis Factor

The Analysis Factor

Statistical Consulting, Resources, and Statistics Workshops for Researchers

  • Home
  • About
    • Our Programs
    • Our Team
    • Our Core Values
    • Our Privacy Policy
    • Employment
    • Guest Instructors
  • Membership
    • Statistically Speaking Membership Program
    • Login
  • Workshops
    • Online Workshops
    • Login
  • Consulting
    • Statistical Consulting Services
    • Login
  • Free Webinars
  • Contact
  • Login

Should I Specify a Model Predictor as Categorical or Continuous?

by Karen Grace-Martin Leave a Comment

Predictor variables in statistical models can be treated as either continuous or categorical.

Usually, this is a very straightforward decision.

Categorical predictors, like treatment group, marital status, or highest educational degree should be specified as categorical.

Likewise, continuous predictors, like age, systolic blood pressure, or percentage of ground cover should be specified as continuous.

But there are numerical predictors that aren’t continuous. And these can sometimes make sense to treat as continuous and sometimes make sense as categorical.

Let’s look at a few examples.

Discrete Predictor Variables

Count predictor variables, like number of therapy sessions or number of symptoms, are numerical but not continuous. They can have whole, positive values, but not decimals.

Another type of discrete variable is when truly continuous variables are only measured at discrete intervals. For example, in longitudinal studies, time is often measured at discrete points: 1 week, 2 weeks, 4 weeks, 8 weeks, 16 weeks post treatment. Time could have been continuous had it been measured in days, hours, or minutes, but here it wasn’t.

This also happens in data sets where a potentially continuous variable has few values in the data set, intentionally or not. For example, when every single individual in the data set has one of three possible ages: 6, 8, and 10.

A clarification: I am not talking about grouping numerical values into categories, like all ages above 8 = old and all ages below 8 = young. I’m talking about making each value of age its own category.

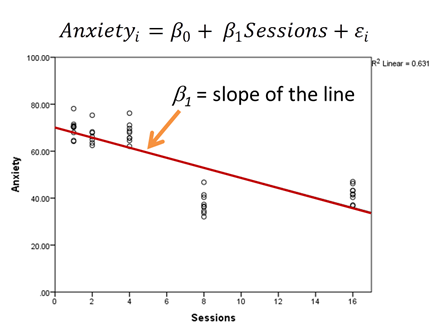
If you specify a predictor as continuous, the software will fit a best-fitting regression line between that predictor and Y, the response variable, after accounting for other variables in the model. The coefficient of that predictor is a slope of the regression line (shown in red).

Because a discrete predictor is numerical, fitting a line to it can be reasonable. Its values are true numbers with meaningful intervals between them.

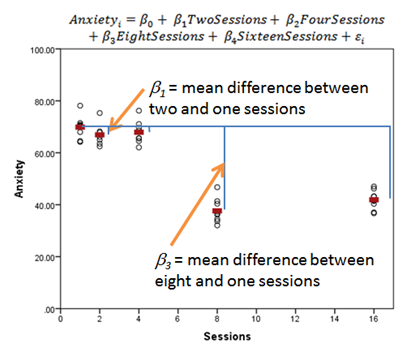
If you specify a predictor as categorical, the software will estimate a mean of Y for each category of the predictor (shown below in red). There will be a set of coefficients for that predictor. Each one measures the difference in the means of Y between one category of X and the reference category.

Considerations

So which do you use?

As always, it depends.

A few things to keep in mind as you decide:

  1. Is your research question about a constant change over X or is it specifically about mean differences at specific values of X?

    If it’s the former, fitting a line makes more sense. If it’s the latter, fitting a set of mean differences makes more sense. The whole point of your analysis is to answer a research question.

  2. How many discrete values of X are there?

    You need a minimum of 3 values of X to fit a line, but with only 3, it can be hard to tell if there really is a linear trend. The more values of X, the more cumbersome it is to have a set of mean differences and the more clearly you can fit a line (or a curve).

  3. Is the actual relationship linear?

    In our example, it isn’t so linear. Instead it looks like there is a jump downward somewhere between 4 and 8 weeks. It may not be realistic to fill in the times between our 5 measured times with a constant slope.

    A set of 5 means may better tell the story in the data. A follow-up study with more time points may tell us a more complete story about whether there is a jump downward somewhere between 4 and 8 sessions or if there is a curve or straight line downward between 4 and 8.

Interpreting Linear Regression Coefficients: A Walk Through Output
Learn the approach for understanding coefficients in that regression as we walk through output of a model that includes numerical and categorical predictors and an interaction.

Tagged With: categorical predictor, continuous predictor, Discrete Counts, Linear Regression Model, Model Building, numeric variable, predictor variable

Related Posts

  • Recoding a Variable from a Survey Question to Use in a Statistical Model
  • What It Really Means to Take an Interaction Out of a Model
  • Simplifying a Categorical Predictor in Regression Models
  • A Strategy for Converting a Continuous to a Categorical Predictor

Reader Interactions

Leave a Reply Cancel reply

Your email address will not be published. Required fields are marked *

Please note that, due to the large number of comments submitted, any questions on problems related to a personal study/project will not be answered. We suggest joining Statistically Speaking, where you have access to a private forum and more resources 24/7.

Primary Sidebar

This Month’s Statistically Speaking Live Training

  • January Member Training: A Gentle Introduction To Random Slopes In Multilevel Models

Upcoming Workshops

  • Logistic Regression for Binary, Ordinal, and Multinomial Outcomes (May 2021)
  • Introduction to Generalized Linear Mixed Models (May 2021)

Read Our Book


Data Analysis with SPSS
(4th Edition)

by Stephen Sweet and
Karen Grace-Martin

Statistical Resources by Topic

  • Fundamental Statistics
  • Effect Size Statistics, Power, and Sample Size Calculations
  • Analysis of Variance and Covariance
  • Linear Regression
  • Complex Surveys & Sampling
  • Count Regression Models
  • Logistic Regression
  • Missing Data
  • Mixed and Multilevel Models
  • Principal Component Analysis and Factor Analysis
  • Structural Equation Modeling
  • Survival Analysis and Event History Analysis
  • Data Analysis Practice and Skills
  • R
  • SPSS
  • Stata

Copyright © 2008–2021 The Analysis Factor, LLC. All rights reserved.
877-272-8096   Contact Us

The Analysis Factor uses cookies to ensure that we give you the best experience of our website. If you continue we assume that you consent to receive cookies on all websites from The Analysis Factor.
Continue Privacy Policy
Privacy & Cookies Policy

Privacy Overview

This website uses cookies to improve your experience while you navigate through the website. Out of these, the cookies that are categorized as necessary are stored on your browser as they are essential for the working of basic functionalities of the website. We also use third-party cookies that help us analyze and understand how you use this website. These cookies will be stored in your browser only with your consent. You also have the option to opt-out of these cookies. But opting out of some of these cookies may affect your browsing experience.
Necessary
Always Enabled

Necessary cookies are absolutely essential for the website to function properly. This category only includes cookies that ensures basic functionalities and security features of the website. These cookies do not store any personal information.

Non-necessary

Any cookies that may not be particularly necessary for the website to function and is used specifically to collect user personal data via analytics, ads, other embedded contents are termed as non-necessary cookies. It is mandatory to procure user consent prior to running these cookies on your website.