• Skip to primary navigation
  • Skip to main content
  • Skip to primary sidebar
The Analysis Factor

The Analysis Factor

Statistical Consulting, Resources, and Statistics Workshops for Researchers

  • Home
  • About
    • Our Programs
    • Our Team
    • Our Core Values
    • Our Privacy Policy
    • Employment
    • Guest Instructors
  • Membership
    • Statistically Speaking Membership Program
    • Login
  • Workshops
    • Online Workshops
    • Login
  • Consulting
    • Statistical Consulting Services
    • Login
  • Free Webinars
  • Contact
  • Login

Simplifying a Categorical Predictor in Regression Models

by Jeff Meyer Leave a Comment

One of the many decisions you have to make when model building is which form each predictor variable should take. One specific version of this decision is whether to combine categories of a categorical predictor.

The greater the number of parameter estimates in a model the greater the number of observations that are needed to keep power constant. The parameter estimates in a linear regression model are the coefficients of the predictors.

Every continuous predictor has one parameter estimate (one regression coefficient). A categorical variable has one fewer than the number of categories of the categorical predictor. Here is a categorical predictor for the number of months since a mother’s last pregnancy.

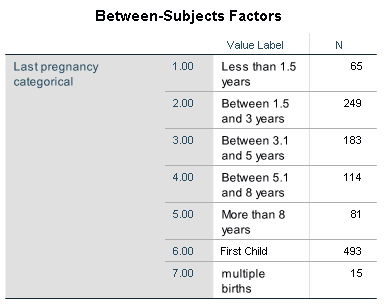
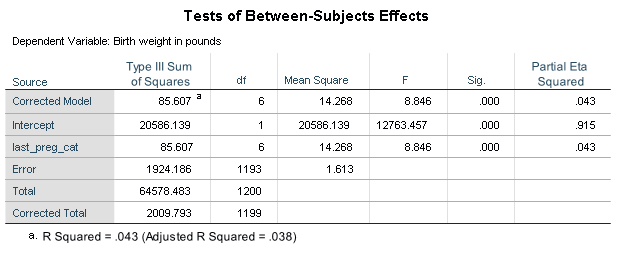
Regressing a baby’s birth weight on this predictor produces the following results.

(click image above to see it larger)

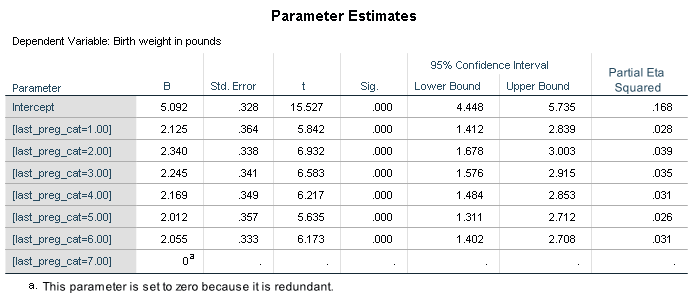
There are six parameter estimates in this model. Remember, more estimates lowers the power of our model.

Do we need seven categories to represent the number of months since the last pregnancy? Remember, the coefficient of a category is the comparison of its birth weight to the birth weight of the base category (reference group). In this model the base category is multiple births.

Multiple births tend to have very low birth weights. The coefficients for the non-multiple birth categories are in the range of 2.01 to 2.34 pounds greater than multiple births. If we used a different category as our base we would most likely have fewer estimates with such low p-values. Please note the main effect of months since last pregnancy as shown in the table “Tests of Between-Subject Effects” would not be affected.

Perhaps we don’t need seven categories.  Running a pairwise comparison can help us determine whether two categories are different. If categories are not statistically different then it might be possible to combine them.

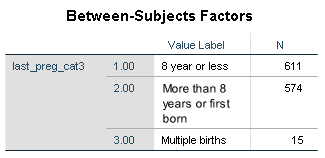
After running the pairwise comparison tests, it was determined that all previous pregnancies within the past eight years could be combined into one category. First born and last pregnancies of more than eight years ago were combined. Multiple births remained in their own category. The categorical predictor now has only three categories.

Below are the results of the model using the categorical variable with three categories.

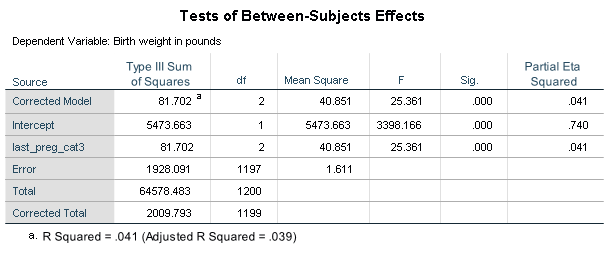
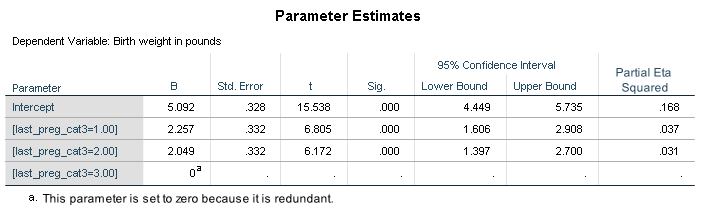
The adjusted R square is higher in the new model with only two parameter estimates. An added bonus, the more parsimonious model will require less written explanation for the final analysis.

One more step is required before deciding which categorical variable to use.  Does the new combination of categories make theoretical sense? Data shows birth weight of multiple birth babies is less than single births. Research has shown that first born babies have lower birth weight than second born babies. What does research show about birth weights when the time between pregnancy is 8 years or more? Researchers should always be aware of the hypothesized population and not fit their models to their sample.

It’s also important to be transparent in these decisions. If you do combine similar categories with similar effects in order to tell a more parsimonious story, make that clear to your reader.

In this example, the decision to choose the smaller categorical variable should not be driven by the slight improvement in the adjusted R-square. The increase is minimal. However, the more parsimonious model will require less written explanation. If the variable is not a key predictor of the analysis this is advantageous.

Jeff Meyer is a statistical consultant with The Analysis Factor, a stats mentor for Statistically Speaking membership, and a workshop instructor. Read more about Jeff here.

Four Critical Steps in Building Linear Regression Models
While you’re worrying about which predictors to enter, you might be missing issues that have a big impact your analysis. This training will help you achieve more accurate results and a less-frustrating model building experience.

Tagged With: categorical predictor, interpreting regression coefficients, Model Building, pairwise, R-squared

Related Posts

  • What It Really Means to Take an Interaction Out of a Model
  • Differences in Model Building Between Explanatory and Predictive Models
  • Four Weeds of Data Analysis That are Easy to Get Lost In
  • A Strategy for Converting a Continuous to a Categorical Predictor

Reader Interactions

Leave a Reply Cancel reply

Your email address will not be published. Required fields are marked *

Please note that, due to the large number of comments submitted, any questions on problems related to a personal study/project will not be answered. We suggest joining Statistically Speaking, where you have access to a private forum and more resources 24/7.

Primary Sidebar

Free Webinars

Binary, Ordinal, and Multinomial Logistic Regression for Categorical Outcomes (Signup)

This Month’s Statistically Speaking Live Training

  • April Member Training: Statistical Contrasts

Upcoming Workshops

  • Logistic Regression for Binary, Ordinal, and Multinomial Outcomes (May 2021)
  • Introduction to Generalized Linear Mixed Models (May 2021)

Read Our Book


Data Analysis with SPSS
(4th Edition)

by Stephen Sweet and
Karen Grace-Martin

Statistical Resources by Topic

  • Fundamental Statistics
  • Effect Size Statistics, Power, and Sample Size Calculations
  • Analysis of Variance and Covariance
  • Linear Regression
  • Complex Surveys & Sampling
  • Count Regression Models
  • Logistic Regression
  • Missing Data
  • Mixed and Multilevel Models
  • Principal Component Analysis and Factor Analysis
  • Structural Equation Modeling
  • Survival Analysis and Event History Analysis
  • Data Analysis Practice and Skills
  • R
  • SPSS
  • Stata

Copyright © 2008–2021 The Analysis Factor, LLC. All rights reserved.
877-272-8096   Contact Us

The Analysis Factor uses cookies to ensure that we give you the best experience of our website. If you continue we assume that you consent to receive cookies on all websites from The Analysis Factor.
Continue Privacy Policy
Privacy & Cookies Policy

Privacy Overview

This website uses cookies to improve your experience while you navigate through the website. Out of these, the cookies that are categorized as necessary are stored on your browser as they are essential for the working of basic functionalities of the website. We also use third-party cookies that help us analyze and understand how you use this website. These cookies will be stored in your browser only with your consent. You also have the option to opt-out of these cookies. But opting out of some of these cookies may affect your browsing experience.
Necessary
Always Enabled

Necessary cookies are absolutely essential for the website to function properly. This category only includes cookies that ensures basic functionalities and security features of the website. These cookies do not store any personal information.

Non-necessary

Any cookies that may not be particularly necessary for the website to function and is used specifically to collect user personal data via analytics, ads, other embedded contents are termed as non-necessary cookies. It is mandatory to procure user consent prior to running these cookies on your website.

SAVE & ACCEPT