 Have you ever heard that “2 tall parents will have shorter children”?
This phenomenon, known as regression to the mean, has been used to explain everything from patterns in hereditary stature (as Galton first did in 1886) to why movie sequels or sophomore albums so often flop.
So just what is regression to the mean (RTM)? (more…)
Most of the p-values we calculate are based on an assumption that our test statistic meets some distribution. Common examples include t distributions, F distributions, 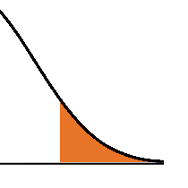 and chi-square distributions.
These distributions are generally a good way to calculate p-values as long as assumptions are met.
But it’s not the only way to calculate a p-value.
Rather than come up with a theoretical probability based on a distribution, exact tests calculate a p-value empirically.
The simplest (and most common) exact test is a Fisher’s exact for a 2×2 table.
Remember calculating empirical probabilities from your intro stats course? All those red and white balls in urns? (more…)
How do you choose between Poisson and negative binomial models for discrete count outcomes?
One key criterion is the relative value of the variance to the mean after accounting for the effect of the predictors. A previous article discussed the concept of a variance that is larger than the model assumes: overdispersion.
(Underdispersion is also possible, but much less common).
There are two ways to check for overdispersion: (more…)
I recently held a free webinar in our The Craft of Statistical Analysis program about Binary, Ordinal, and Nominal Logistic Regression.
It was a record crowd and we didn’t get through everyone’s questions, so I’m answering some here on the site. They’re grouped by topic, and you will probably get more out of it if you watch the webinar recording. It’s free.
The following questions refer to this logistic regression model: (more…)
We previously examined why a linear regression and negative binomial regression were not viable models for predicting the expected length of stay in the hospital for people with the flu. A linear regression model was not appropriate because our outcome variable, length of stay, was discrete and not continuous.
A negative binomial model wasn’t the proper choice because the minimum length of stay is not zero. The minimum length of stay is one day. Negative binomial and Poisson models can only be used on data where the observations’ outcome have the possibility of having a zero count.
We need to use a truncated negative binomial model to analyze the expected length of stay of people admitted to the hospital who have the flu. Calculating the expected length of stay is an easy task once we create our model. (more…)
Imagine this scenario:
This year’s flu strain is very vigorous. The number of people checking in at hospitals is rapidly increasing. Hospitals are desperate to know if they have enough beds to handle those who need their help.
You have been asked to analyze a previous year’s hospitalization length of stay by people with the flu who had been admitted to the hospital. The predictors in your data set are age group, gender and race of those admitted. You also have an indicator that signifies whether the hospital was privately or publicly run.
(more…)