• Skip to primary navigation
  • Skip to main content
  • Skip to primary sidebar
The Analysis Factor

The Analysis Factor

Statistical Consulting, Resources, and Statistics Workshops for Researchers

  • Home
  • Our Programs
    • Membership
    • Online Workshops
    • Free Webinars
    • Consulting Services
  • About
    • Our Team
    • Our Core Values
    • Our Privacy Policy
    • Employment
    • Collaborate with Us
  • Statistical Resources
  • Contact
  • Blog
  • Login

The Problem with Linear Regression for Count Data

by Jeff Meyer Leave a Comment

Imagine this scenario:

This year’s flu strain is very vigorous. The number of people checking in at hospitals is rapidly increasing. Hospitals are desperate to know if they have enough beds to handle those who need their help.

You have been asked to analyze a previous year’s hospitalization length of stay by people with the flu who had been admitted to the hospital. The predictors in your data set are age group, gender and race of those admitted. You also have an indicator that signifies whether the hospital was privately or publicly run.

You use a linear regression to regress your outcome variable, number of days spent in the hospital, on the predictors mentioned above. Your game plan is to use histograms to show hospital administrators the predicted length of stay based on different demographics. They can then use the predicted responses to match the client who they serve.

You start by first graphing the length of stay by private and public hospitals.

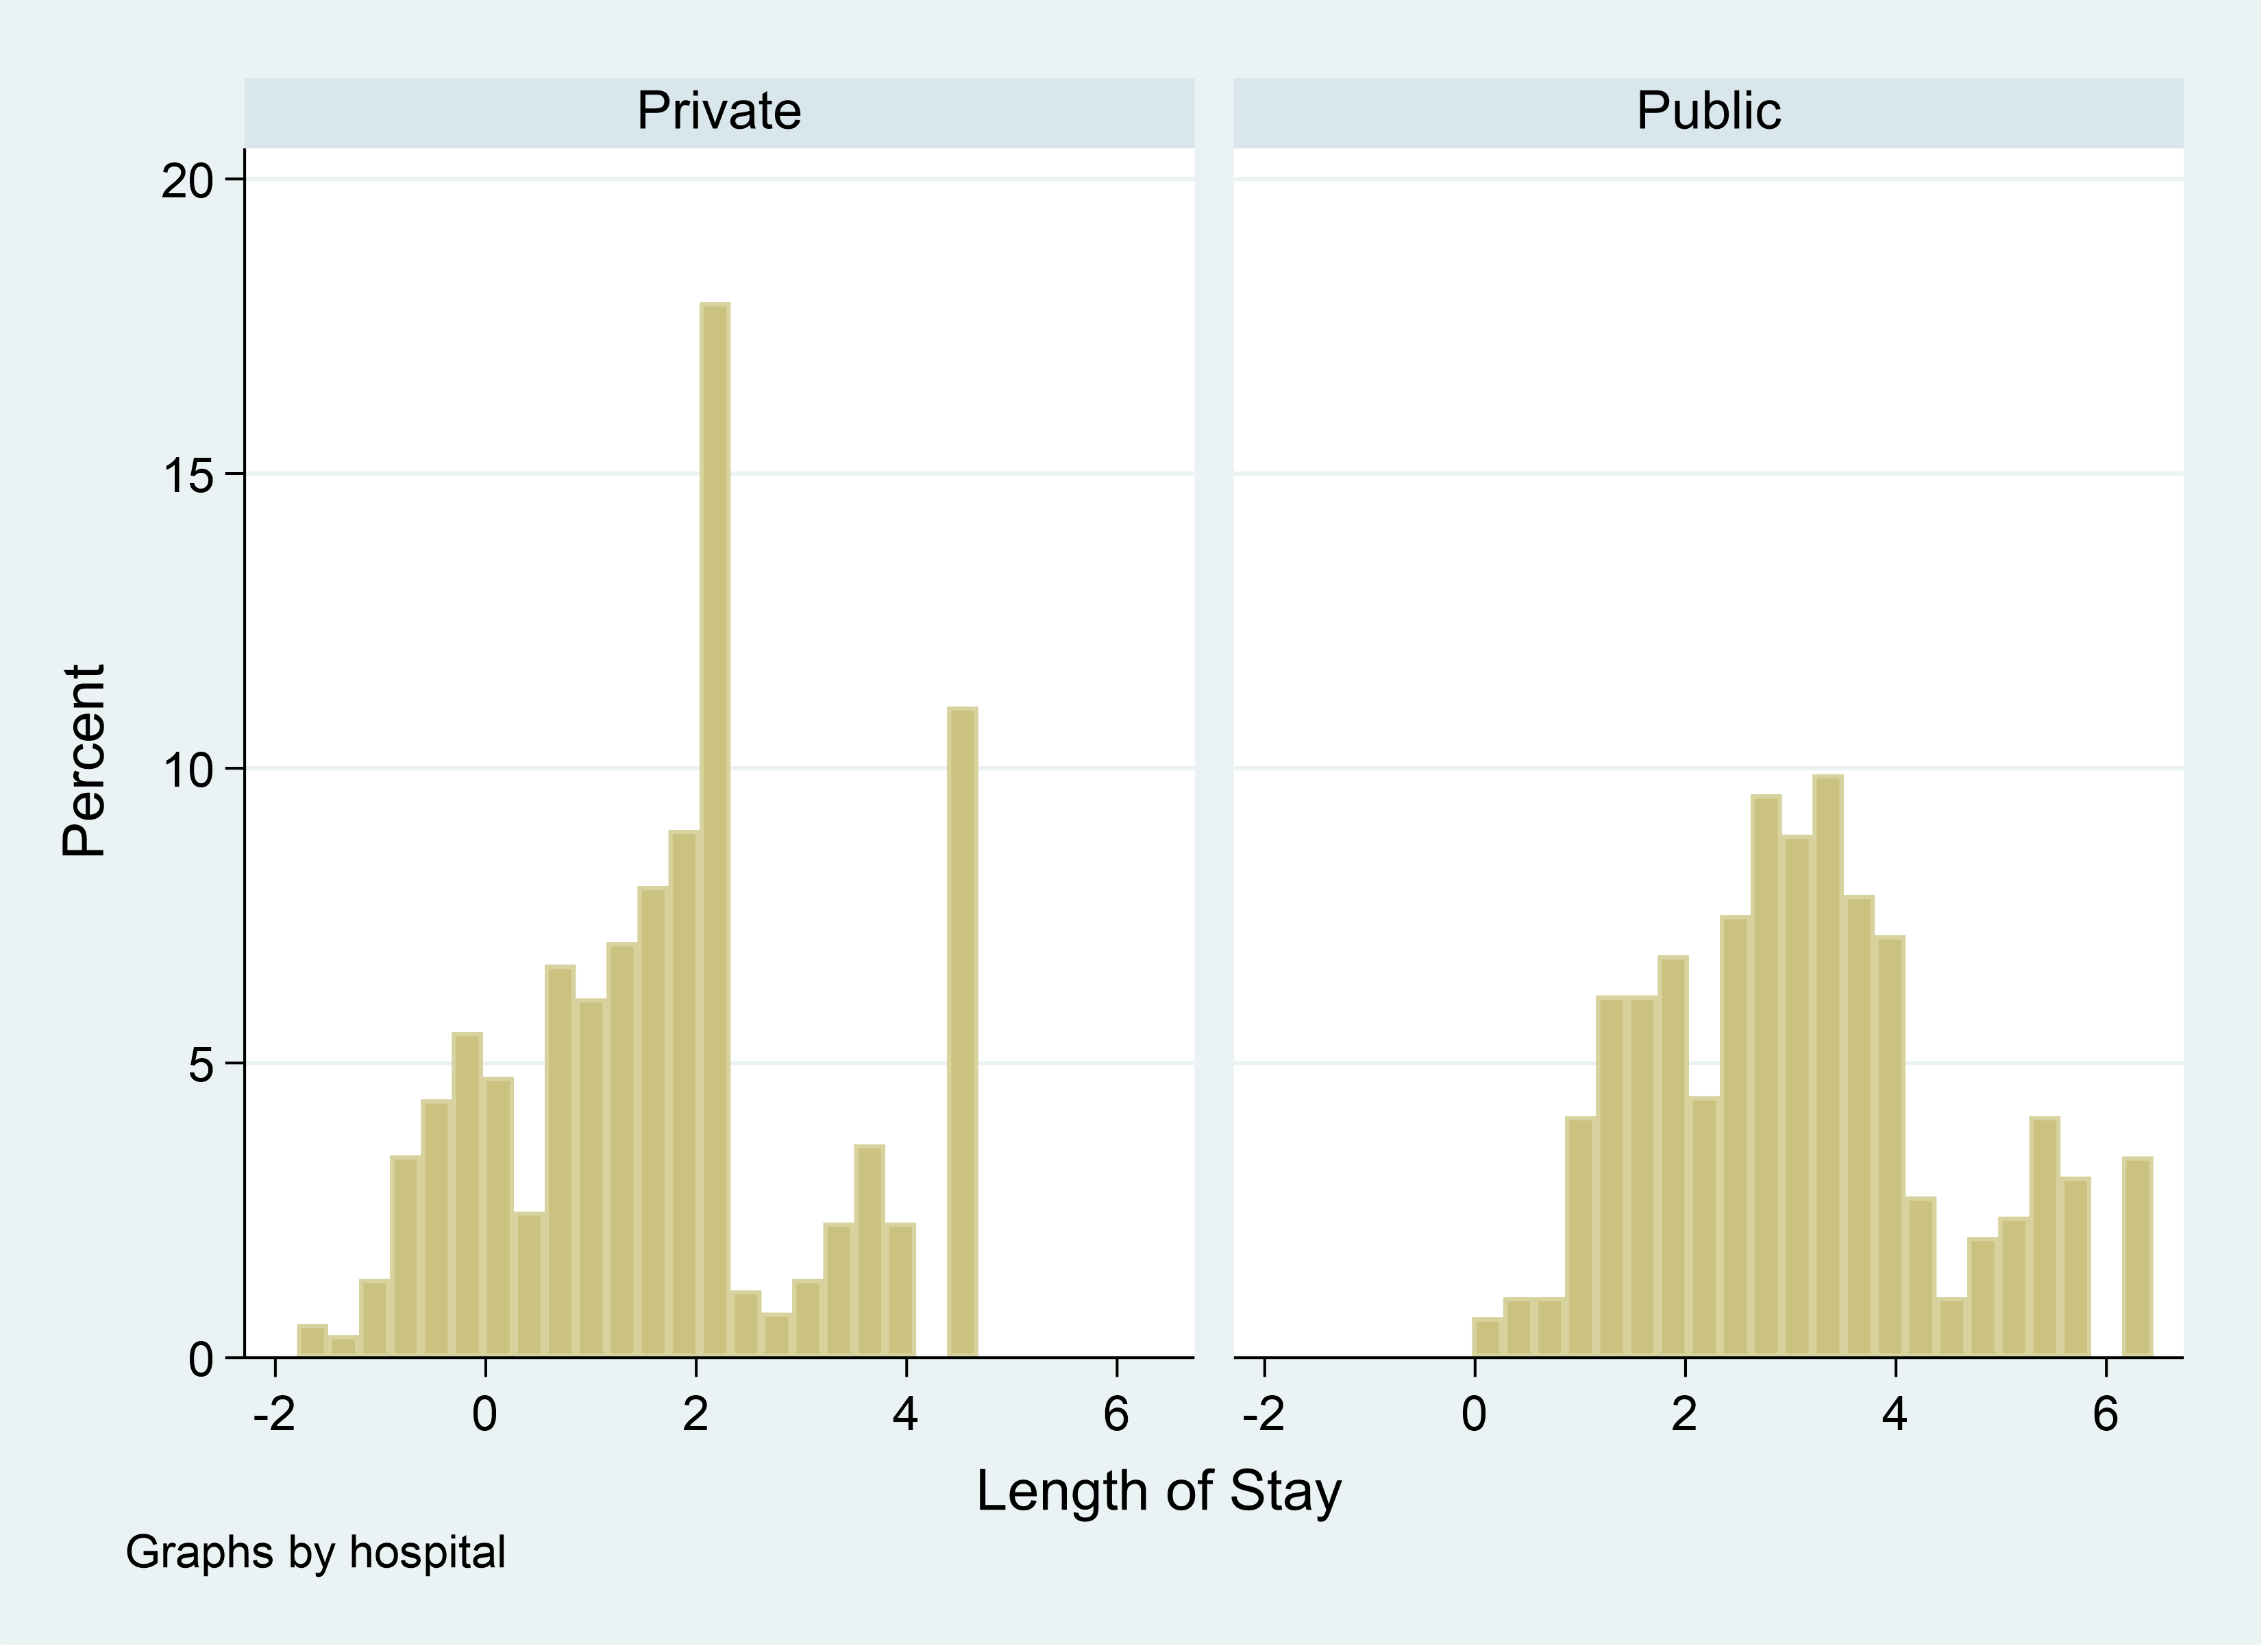
You notice that there are people with a negative length of stay in private hospitals. So you ask a colleague how to explain that!

She points out that your outcome is the count of the number of days hospitalized. Therefore you need to use either a Poisson or negative binomial count model.

You then rerun the model using a negative binomial model. Your graph now looks a lot better.

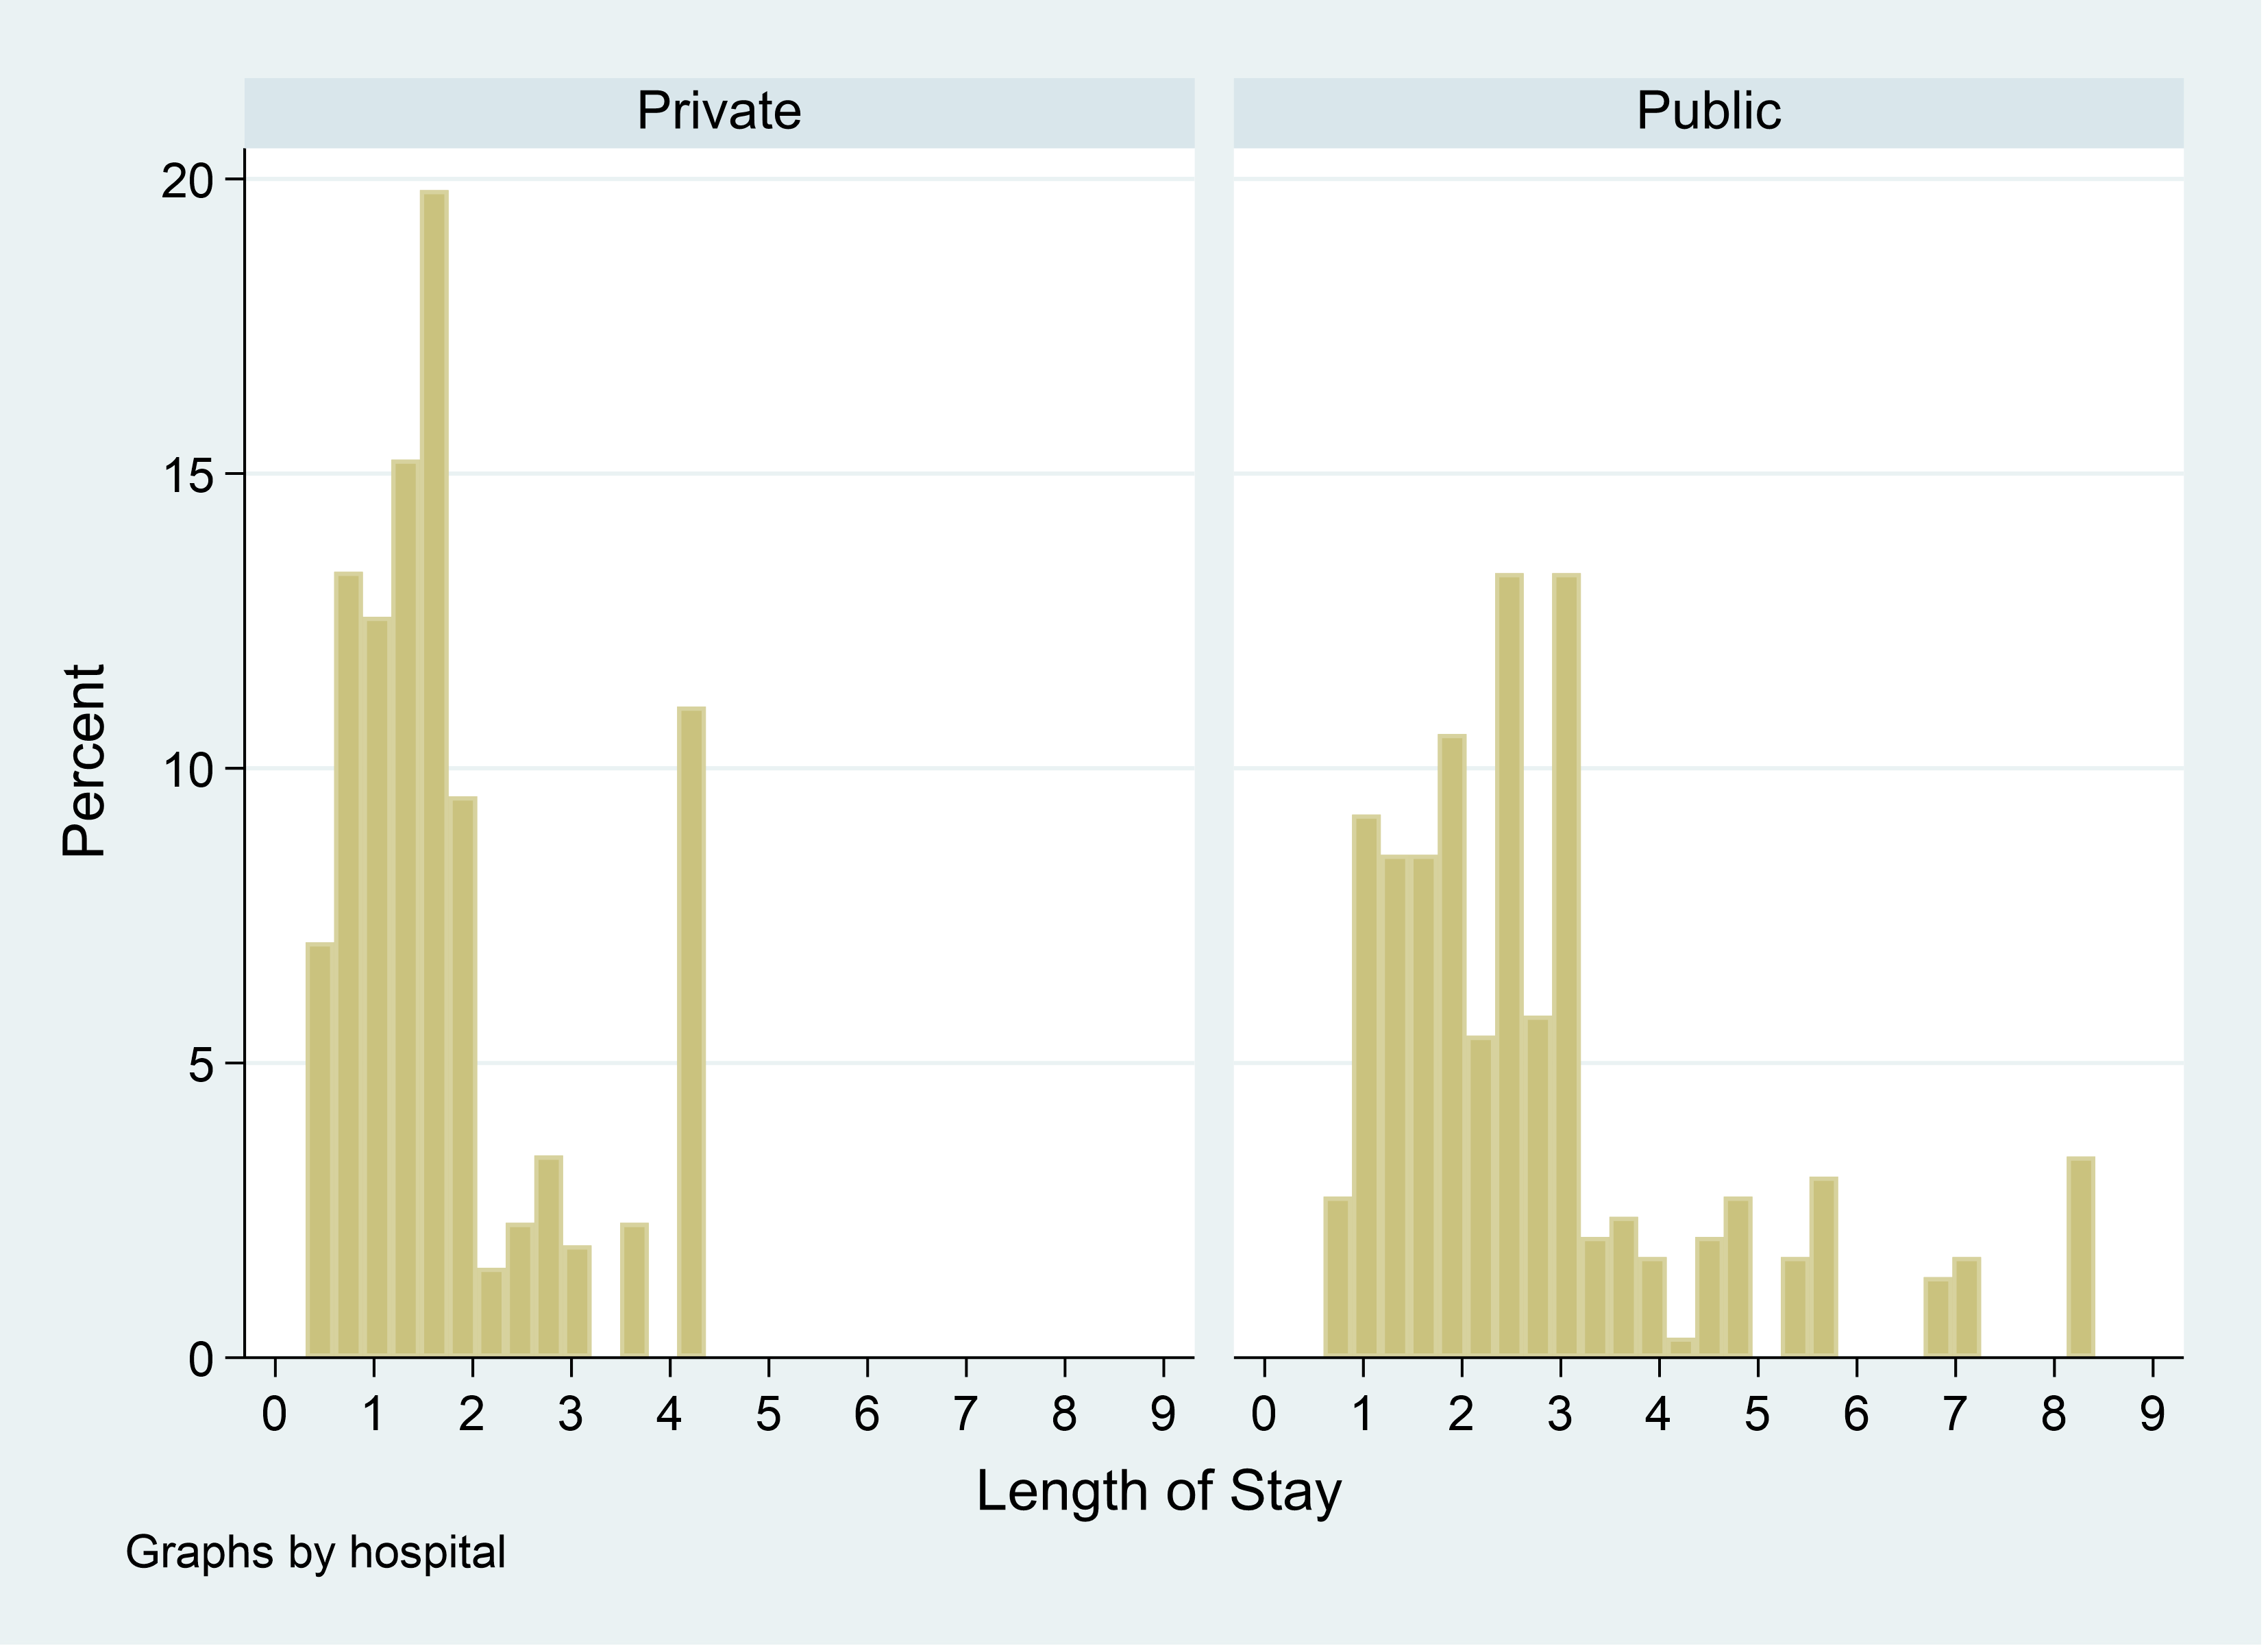
Interestingly the length of stay is longer in a public hospital. But you also notice there are a fair number of people who stayed less than a full day in the private hospitals.  This can’t be true because the minimum length of stay is 1 day. Your data shows the minimum length of stay is one day.

How can this problem be solved? You need to use a truncated count model. A truncated model allows you to set the minimum count. In this case it is 1.  Here is the histogram using a truncated negative binomial count model.

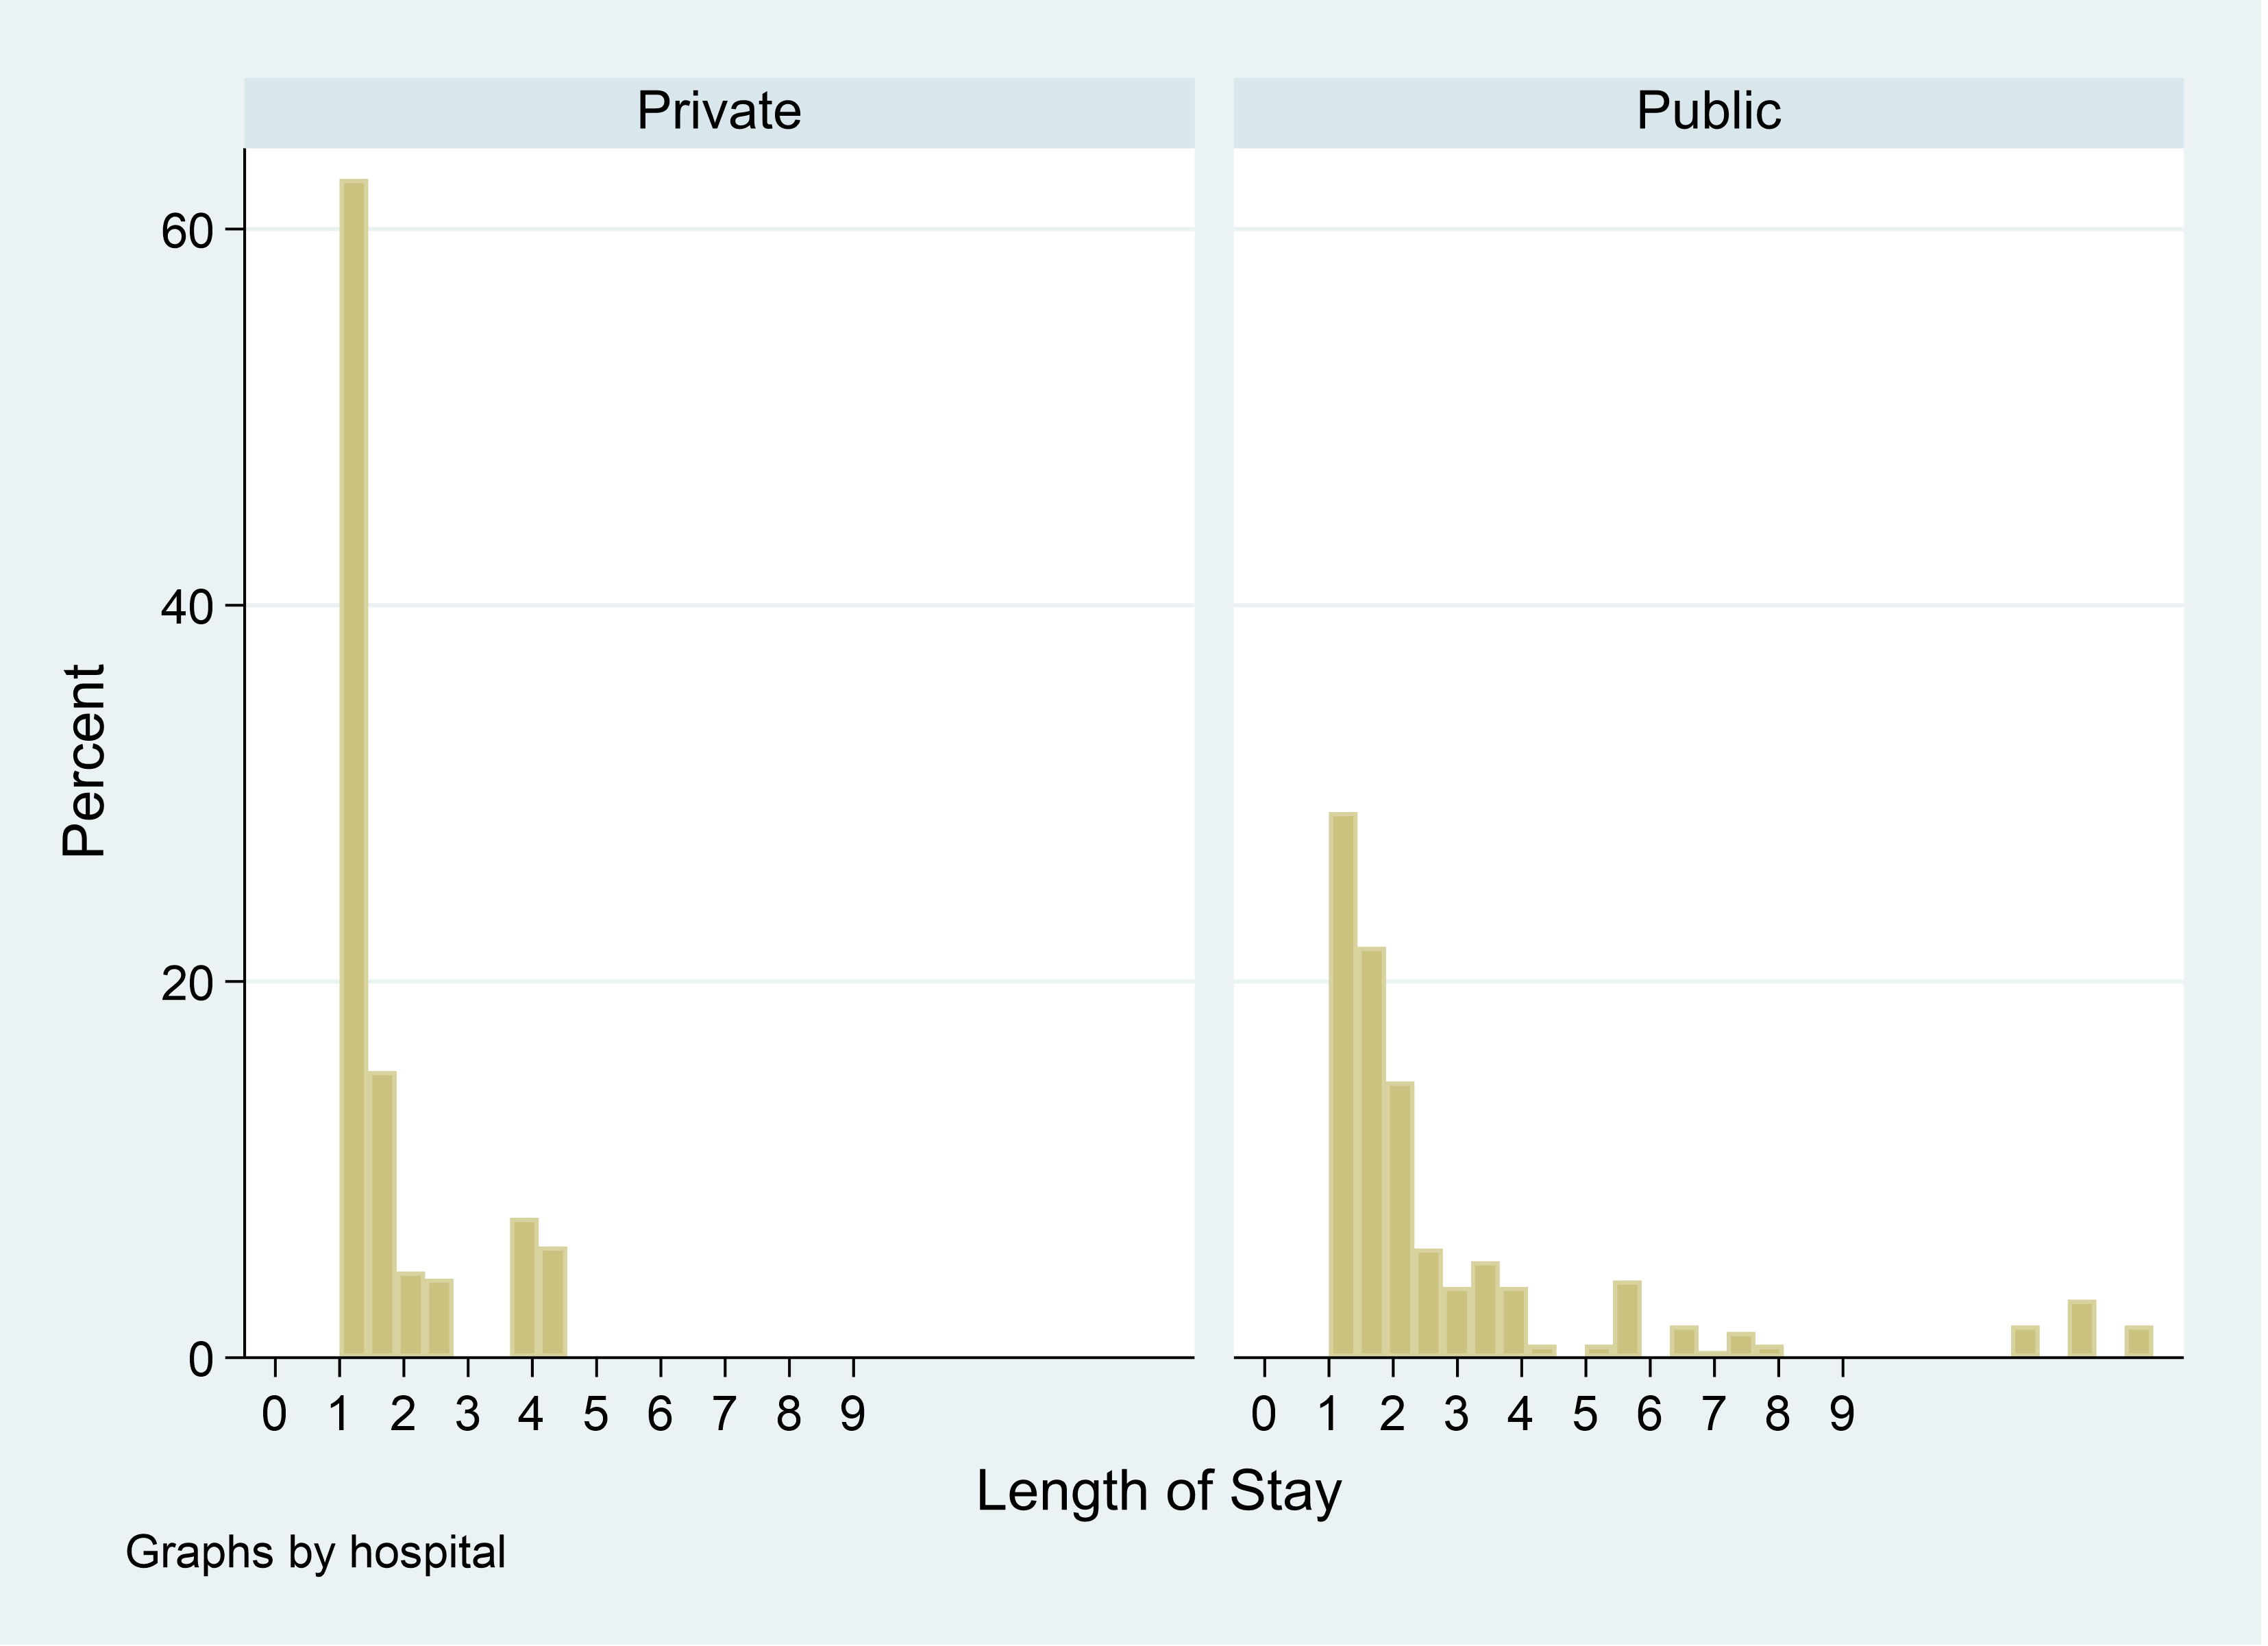
From here you can now start controlling for various demographic factors. You may wonder why the predicted values aren’t all whole numbers. We will look at that in the next article.

Jeff Meyer is a statistical consultant with The Analysis Factor, a stats mentor for Statistically Speaking membership, and a workshop instructor. Read more about Jeff here.

Poisson and Negative Binomial Regression for Count Data
Learn when you need to use Poisson or Negative Binomial Regression in your analysis, how to interpret the results, and how they differ from similar models.

Tagged With: Count data, count model, linear regression, negative binomial, Poisson Regression, predicted count, Truncated

Related Posts

  • The Importance of Including an Exposure Variable in Count Models
  • Analyzing Zero-Truncated Count Data: Length of Stay in the ICU for Flu Victims
  • Count Models: Understanding the Log Link Function
  • Poisson or Negative Binomial? Using Count Model Diagnostics to Select a Model

Reader Interactions

Leave a Reply Cancel reply

Your email address will not be published. Required fields are marked *

Please note that, due to the large number of comments submitted, any questions on problems related to a personal study/project will not be answered. We suggest joining Statistically Speaking, where you have access to a private forum and more resources 24/7.

Primary Sidebar

This Month’s Statistically Speaking Live Training

  • Member Training: Introduction to SPSS Software Tutorial

Upcoming Free Webinars

Poisson and Negative Binomial Regression Models for Count Data

Upcoming Workshops

  • Analyzing Count Data: Poisson, Negative Binomial, and Other Essential Models (Jul 2022)
  • Introduction to Generalized Linear Mixed Models (Jul 2022)

Copyright © 2008–2022 The Analysis Factor, LLC. All rights reserved.
877-272-8096   Contact Us

The Analysis Factor uses cookies to ensure that we give you the best experience of our website. If you continue we assume that you consent to receive cookies on all websites from The Analysis Factor.
Continue Privacy Policy
Privacy & Cookies Policy

Privacy Overview

This website uses cookies to improve your experience while you navigate through the website. Out of these, the cookies that are categorized as necessary are stored on your browser as they are essential for the working of basic functionalities of the website. We also use third-party cookies that help us analyze and understand how you use this website. These cookies will be stored in your browser only with your consent. You also have the option to opt-out of these cookies. But opting out of some of these cookies may affect your browsing experience.
Necessary
Always Enabled
Necessary cookies are absolutely essential for the website to function properly. This category only includes cookies that ensures basic functionalities and security features of the website. These cookies do not store any personal information.
Non-necessary
Any cookies that may not be particularly necessary for the website to function and is used specifically to collect user personal data via analytics, ads, other embedded contents are termed as non-necessary cookies. It is mandatory to procure user consent prior to running these cookies on your website.
SAVE & ACCEPT