When our outcome variable is the frequency of occurrence of an event, we will typically use a count model to analyze the results. There are numerous count models. A few examples are: Poisson, negative binomial, zero-inflated Poisson and truncated negative binomial.
There are specific requirements for which count model to use. The models are not interchangeable. But regardless of the model we use, there is a very important prerequisite that they all share.
We must identify the period of time or area of space in which the counts were generated.
The term used for modeling the period of time or area of space is exposure. The exposure variable modifies each observation from a count into a rate per period of time or area.
For example, if you were to count birds at various locations, you would need to know the area of space in which you are doing the count. Ten birds counted within 100 square feet is more than 10 birds counted within 625 square feet.
Counting the number of births during the month of February (28 days) represents a different length of time than the number of births during the month of January (31 days).
If we don’t take into account the different exposures, we will have biased results.
An Exposure Variable Example
Let’s look at a model where the outcome is the number of deaths.
The predictors in the model are whether the deceased smoked and what age bracket they were in. The exponentiated model coefficients represent the incidence rate ratio (IRR) of the category compared to the base category.
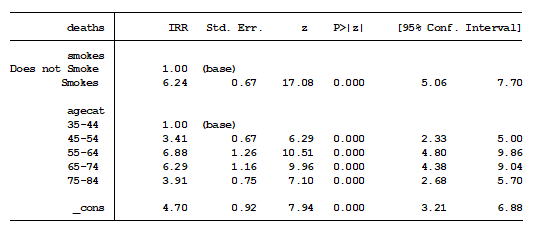
The results tell us that smokers have a rate of death 6.24 times greater than non-smokers when controlling for their age bracket.
We also find that 55- to 64-year-olds have a rate of death 6.88 times more than 35- to 44-year-olds.
Interesting enough, we see that the rate of death for 75- to 84-year-olds is lower than 55- to 64-year-olds, when controlling for smoking. I would have to think that doesn’t make sense.
Converting Counts to Rates
Question: Over what period or area were the outcomes measured? Were they measured over the same period of time and over the same size population?
It turns out they were not.
Each observation measures the number of deaths by person-years. The data in this analysis were collected from English counties. It contains the number of smokers and non-smokers per age category and the number of deaths over a specific time period in each county.
As you can imagine, the number of people living in county A and county B will differ. So will the number of years each county is measured.
Including an exposure variable, such as person-years, allows the counts of deaths to be comparable. We don’t want to predict more deaths just because a county has more people or because we measured it for a longer period of time.
After including person-years in our model as the exposure variable, we get very different results.
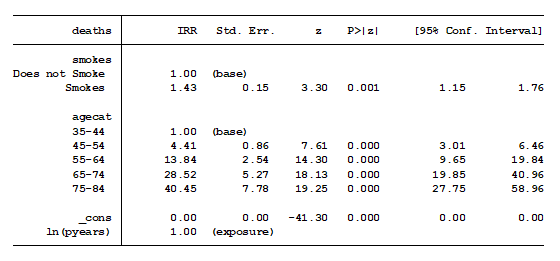
The incidence rate ratio drops from 6.24 to 1.43 when comparing smokers to non-smokers. In addition, as age increases, the incident rate ratio (as compared to the base category) increases. This intuitively makes sense.
Note: Some statistical software requires the analyst to include the “offset” variable rather than the “exposure” variable. If that is the case with your software, you will need to take the natural log of the variable in order to include it in the model.
**This article was updated Nov. 19th, 2020.
Jeff Meyer is a statistical consultant with The Analysis Factor, a stats mentor for Statistically Speaking membership, and a workshop instructor. Read more about Jeff here.

I am trying to model survival of different drosophila species on toxins. I am using Generalized linear mixed modeling, with poisson regression. However, I took of percent survivorship because my initial larvae added were different between species (20 for one species, and 15 for the others). Should the number of larvae initially added be considered as exposure and included as an offset variable?
Apologies for being an absolute beginner in statistics.
It’s hard for me to say without asking a lot more questions. You may actually want to do a Survival Analysis instead, which takes initial count into account.
Please could you suggest a method for analysing count data, contains real ZEROS (around 20-45 % of data), in SAS? The data is insect counts from pheromone-baited traps, with climate variables, date of collection and location information.
Hi Collino,
There are a number of ways of dealing with excess zeros for count data, including negative binomial regression, zero inflated poisson or negative binomial, and hurdle models. Here are some resources:
https://www.theanalysisfactor.com/zero-inflated-poisson-models-for-count-outcomes/
https://www.theanalysisfactor.com/poisson-and-negative-binomial-regression/
I am using children ever born as an outcome variable and want to see the effect of women empowerment on it using zero inflated negative binomial regression. Shall I use an offset variable like that of age? What is the difference if I use age as an independent, exposure or offset? What about the variable marital status?
The exposure variable has to be a unit of time, distance, or some other quantity that could affect the counts simply because there is more opportunity to have a higher count. So Age could work. Older women have more years to have children.
Thank you so much for your great article. But exactly is the exposure variable doing? Is it diving the number of y/exposure? But wouldn’t we have to divide the X variables, then, too? (for each case)
How do we actually include the exposure variable in the model? Is it included as a new X variable? Or do we divide Y through exposure?
Thanks for helping me.
Hi Julian,
The exposure variable is used by the statistical software to weight the observations so that each observation’s time period or area of measurement are equivalent. This type of model is also known as a proportional intensity model. You as the analyst do not need to make any adjustments, the software will make the adjustments for you. How you include it in the model depends upon which statistical software package you are using. It’s basically an option that you add to your model.
Jeff
So does this mean all the predictor variables are also weighted by the exposure/offset variable?
For example, I have an outcome variable of crime count, and want to use neighbourhood size as the offset variable. My main predictor is number of alcohol outlets. Does having neighbourhood size as the offset variable mean that the number of bars is also turned into a rate (number of alcohol outlets/neighbourhood size). Or should I construct an alcohol outlets rate variable myself (i.e. Number of alcohol outlets / neighbourhood size)?
Thanks
Thank you so much for this very helpful article, as well as the very helpful Exposure Variable in Poisson Regression Models article.
I was wondering if you can give an example of what the person-years exposure variable would look like from this article? Would this be the number of total people observed per county per duration of measurement year such as:
– 200k for county A for measurement of 7 years
– 100k for county B for measurement of 7 years
– 600k for county A for measurement of 5 years
or the total people observed per duration of measurement year such as:
– 300k for measurement of 7 years
– 600k for measurement of 5 years
or something else? Should it be number of people total observed, or only those that died?
Thank you so much for your time and help!
Natalie
Hi Natalie,
You will want each observation’s exposure to have the same common denominator. Let’s suppose that the outcome is number of deaths that were measured over different periods of time and different sizes of population, similar to what you stated above. The exposure is the total number of people observed. Your exposure for county A is 200k*7, county B 100k*7 and county C 600k * 5. The exposure relates to each individual observation, not groups of observations.
Jeff