We previously examined why a linear regression and negative binomial regression were not viable models for predicting the expected length of stay in the hospital for people with the flu. A linear regression model was not appropriate because our outcome variable, length of stay, was discrete and not continuous.
A negative binomial model wasn’t the proper choice because the minimum length of stay is not zero. The minimum length of stay is one day. Negative binomial and Poisson models can only be used on data where the observations’ outcome have the possibility of having a zero count.
We need to use a truncated negative binomial model to analyze the expected length of stay of people admitted to the hospital who have the flu. Calculating the expected length of stay is an easy task once we create our model.
Most software packages give you at least two options for predicting the outcome. Because negative binomial regression uses a natural log link, the regression coefficients are all on a natural log scale. Just like in linear regression, you can compute your predicted values using these regression coefficients in a linear combination with the values of X, but you’ll end up with predicted ln(counts), not predicted counts.
This “linear” prediction is rarely useful for presenting results.
Our next choice is to predict the expected count on its original scale. This is called the incident rate and is simply the linear prediction exponentiated. This is the result of which we have interest. Here’s the summary table, which gives us the mean, standard deviation, minimum value and maximum value of all of the predicted counts.
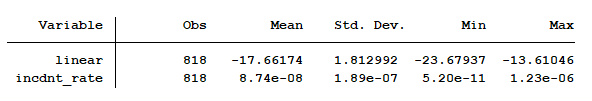
If I didn’t know anything about natural log exponents I might believe the “linear” results were accurate. But I can’t quite understand the incident rate results. How could the maximum predicted count be 0.00000123? The data set’s actual mean number of days spent in the hospital is 2.18 days.
Where did the model go wrong?
It turns out there is one more method for predicting the expected number of days spent in the hospital. This is the conditional mean, which takes into account the truncation. It is: E(y| y>LL).
This translates to the expected count of “length of stay” given that “length of stay” must be greater than LL, the lower limit. The lower limit for this model was set at 0, meaning that all values must be greater than zero. Since this is a discrete model, the minimum value is 1.
Calculating the conditional mean value of “y,” given the predictors of the model and the lower limit of zero, the summary table for our expected length of stay is:
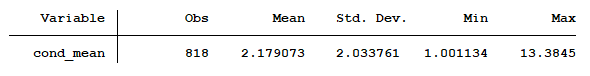
A minimum length of stay is one day and the maximum length of stay is 13 days.
Jeff Meyer is a statistical consultant with The Analysis Factor, a stats mentor for Statistically Speaking membership, and a workshop instructor. Read more about Jeff here.

Leave a Reply