• Skip to primary navigation
  • Skip to main content
  • Skip to primary sidebar
The Analysis Factor

The Analysis Factor

Statistical Consulting, Resources, and Statistics Workshops for Researchers

  • Home
  • About
    • Our Programs
    • Our Team
    • Our Core Values
    • Our Privacy Policy
    • Employment
    • Guest Instructors
  • Membership
    • Statistically Speaking Membership Program
    • Login
  • Workshops
    • Online Workshops
    • Login
  • Consulting
    • Statistical Consulting Services
    • Login
  • Free Webinars
  • Contact
  • Login

predicted count

Poisson or Negative Binomial? Using Count Model Diagnostics to Select a Model

by Jeff Meyer 7 Comments

How do you choose between Poisson and negative binomial models for discrete count outcomes?

One key criterion is the relative value of the variance to the mean after accounting for the effect of the predictors. A previous article discussed the concept of a variance that is larger than the model assumes: overdispersion.

(Underdispersion is also possible, but much less common).

There are two ways to check for overdispersion: [Read more…] about Poisson or Negative Binomial? Using Count Model Diagnostics to Select a Model

Tagged With: count model, dispersion statistic, Model Fit, negative binomial, overdispersion, poisson, predicted count, residual plot

Related Posts

  • Overdispersion in Count Models: Fit the Model to the Data, Don’t Fit the Data to the Model
  • The Problem with Linear Regression for Count Data
  • The Importance of Including an Exposure Variable in Count Models
  • Analyzing Zero-Truncated Count Data: Length of Stay in the ICU for Flu Victims

Getting Accurate Predicted Counts When There Are No Zeros in the Data

by Jeff Meyer Leave a Comment

We previously examined why a linear regression and negative binomial regression were not viable models for predicting the expected length of stay in the hospital for people with the flu.  A linear regression model was not appropriate because our outcome variable, length of stay, was discrete and not continuous.

A negative binomial model wasn’t the proper choice because the minimum length of stay is not zero. The minimum length of stay is one day. Negative binomial and Poisson models can only be used on data where the observations’ outcome have the possibility of having a zero count.

We need to use a truncated negative binomial model to analyze the expected length of stay of people admitted to the hospital who have the flu. Calculating the expected length of stay is an easy task once we create our model. [Read more…] about Getting Accurate Predicted Counts When There Are No Zeros in the Data

Tagged With: conditional mean, Count data, incidence rate ratio, linear regression, Negative Binomial Regression, predicted count, truncated negative binomial model, Zero Truncated

Related Posts

  • The Importance of Including an Exposure Variable in Count Models
  • Count Models: Understanding the Log Link Function
  • The Problem with Linear Regression for Count Data
  • A Few Resources on Zero-Inflated Poisson Models

The Problem with Linear Regression for Count Data

by Jeff Meyer Leave a Comment

Imagine this scenario:

This year’s flu strain is very vigorous. The number of people checking in at hospitals is rapidly increasing. Hospitals are desperate to know if they have enough beds to handle those who need their help.

You have been asked to analyze a previous year’s hospitalization length of stay by people with the flu who had been admitted to the hospital. The predictors in your data set are age group, gender and race of those admitted. You also have an indicator that signifies whether the hospital was privately or publicly run.

[Read more…] about The Problem with Linear Regression for Count Data

Tagged With: Count data, count model, linear regression, negative binomial, Poisson Regression, predicted count, Truncated

Related Posts

  • The Importance of Including an Exposure Variable in Count Models
  • Analyzing Zero-Truncated Count Data: Length of Stay in the ICU for Flu Victims
  • Count Models: Understanding the Log Link Function
  • Poisson or Negative Binomial? Using Count Model Diagnostics to Select a Model

Two-Way Tables and Count Models: Expected and Predicted Counts

by Jeff Meyer Leave a Comment

by Jeff Meyer

In a previous article, we discussed how incidence rate ratios calculated in a Poisson regression can be determined from a two-way table of categorical variables.

Statistical software can also calculate the expected (aka predicted) count for each group. Below is the actual and expected count of the number of boys and girls participating and not participating in organized sports.

cm-twowaytables-1


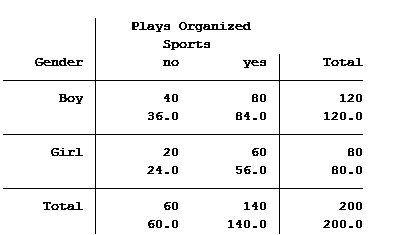
The value in the top of each cell is the actual count (40 boys do not play organized sports) and the bottom value is the expected/predicted count (36 boys are predicted to not play organized sports).

The Poisson model that we ran in the previous article generated the following table: [Read more…] about Two-Way Tables and Count Models: Expected and Predicted Counts

Tagged With: categorical variable, expected count, poisson, predicted count, two-way table

Related Posts

  • Poisson or Negative Binomial? Using Count Model Diagnostics to Select a Model
  • Getting Accurate Predicted Counts When There Are No Zeros in the Data
  • The Problem with Linear Regression for Count Data
  • Analyzing Zero-Truncated Count Data: Length of Stay in the ICU for Flu Victims

Primary Sidebar

Free Webinars

Effect Size Statistics on Tuesday, Feb 2nd

This Month’s Statistically Speaking Live Training

  • January Member Training: A Gentle Introduction To Random Slopes In Multilevel Models

Upcoming Workshops

  • Logistic Regression for Binary, Ordinal, and Multinomial Outcomes (May 2021)
  • Introduction to Generalized Linear Mixed Models (May 2021)

Read Our Book


Data Analysis with SPSS
(4th Edition)

by Stephen Sweet and
Karen Grace-Martin

Statistical Resources by Topic

  • Fundamental Statistics
  • Effect Size Statistics, Power, and Sample Size Calculations
  • Analysis of Variance and Covariance
  • Linear Regression
  • Complex Surveys & Sampling
  • Count Regression Models
  • Logistic Regression
  • Missing Data
  • Mixed and Multilevel Models
  • Principal Component Analysis and Factor Analysis
  • Structural Equation Modeling
  • Survival Analysis and Event History Analysis
  • Data Analysis Practice and Skills
  • R
  • SPSS
  • Stata

Copyright © 2008–2021 The Analysis Factor, LLC. All rights reserved.
877-272-8096   Contact Us

The Analysis Factor uses cookies to ensure that we give you the best experience of our website. If you continue we assume that you consent to receive cookies on all websites from The Analysis Factor.
Continue Privacy Policy
Privacy & Cookies Policy

Privacy Overview

This website uses cookies to improve your experience while you navigate through the website. Out of these, the cookies that are categorized as necessary are stored on your browser as they are essential for the working of basic functionalities of the website. We also use third-party cookies that help us analyze and understand how you use this website. These cookies will be stored in your browser only with your consent. You also have the option to opt-out of these cookies. But opting out of some of these cookies may affect your browsing experience.
Necessary
Always Enabled

Necessary cookies are absolutely essential for the website to function properly. This category only includes cookies that ensures basic functionalities and security features of the website. These cookies do not store any personal information.

Non-necessary

Any cookies that may not be particularly necessary for the website to function and is used specifically to collect user personal data via analytics, ads, other embedded contents are termed as non-necessary cookies. It is mandatory to procure user consent prior to running these cookies on your website.