• Skip to primary navigation
  • Skip to main content
  • Skip to primary sidebar
The Analysis Factor

The Analysis Factor

Statistical Consulting, Resources, and Statistics Workshops for Researchers

  • Home
  • About
    • Our Programs
    • Our Team
    • Our Core Values
    • Our Privacy Policy
    • Employment
    • Guest Instructors
  • Membership
    • Statistically Speaking Membership Program
    • Login
  • Workshops
    • Online Workshops
    • Login
  • Consulting
    • Statistical Consulting Services
    • Login
  • Free Webinars
  • Contact
  • Login

Overdispersion in Count Models: Fit the Model to the Data, Don’t Fit the Data to the Model

by Jeff Meyer Leave a Comment

by Jeff Meyer

If you have count data you use a Poisson model for the analysis, right?

The key criterion for using a Poisson model is after accounting for the effect of predictors, the mean must equal the variance. If the mean doesn’t equal the variance then all we have to do is transform the data or tweak the model, correct?

Let’s see how we can do this with some real data. A survey was done in Australia during the peak of the flu season. The outcome variable is the total number of times people asked for medical advice from any source over a two-week period.

We are trying to determine what influences people with flu symptoms to seek medical advice. The mean number of times was 0.516 times and the variance 1.79.

The mean does not equal the variance even after accounting for the model’s predictors.

Here are the results for this model:

cm-fitthemodel-1

cm-fitthemodel-2

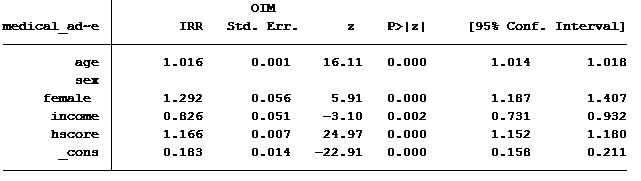
Running the analysis, we find our model generated a Pearson Chi2 dispersion statistic of 2.924. If the variance equals the mean this dispersion statistic should approximate 1.

Running an overdispersed Poisson model will generate understated standard errors. Understated standard errors can lead to erroneous conclusions.

A number of excellent text books provide methods of eliminating or reducing the overdispersion of the data. One of the methods is known as “scaling the standard errors”.  The model weight is replaced with “the inverse square root of the dispersion statistic”.

How this works is: the model is run, the dispersion statistic is calculated and then the model standard errors are multiplied by the square root of the dispersion.

Back in the good old days before computers you had to do all this by hand. Today most statistical software packages will do this for you. You just have to write the syntax correctly. Here are the results when we adjust the standard errors by the dispersion statistic.

cm-fitthemodel-3

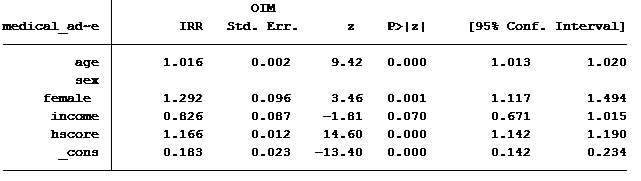
Notice that the coefficients are identical but the standard errors are larger for the scaled version, which is what we want.

But does correcting for our overdispersion in this manner mean that we should use the scaled Poisson model?

There are other methods we could choose from: “quasi-likelihood” model, sandwich or robust variance estimators or bootstrapped standard errors.

Seldom would all methods generate the same results.

My suggestion: rather than use an ad-hoc method to make a model work that doesn’t quite fit, use the count model that best fits the data.

Graphing can be an excellent way to see how a model fits the data.  Phil Ender at UCLA created a third party add-on for Stata users called nbvargr. Joseph Hilbe in his book “Modeling Count Data” provides the code (syntax) to generate similar graphs in Stata, R and SAS.

cm-fitthemodel-4

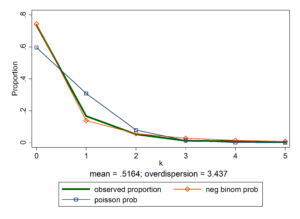
You can see from the graph that the negative binomial probability curve fits the data better than the Poisson probability curve.

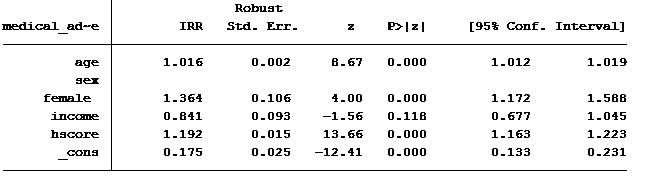
Here is the output using a negative binomial model.

cm-fitthemodel-5

Please note that there are a few quantitative methods for determine the best model for the data as well. These should be used as well when determining which model fits the data best.


Jeff Meyer is a statistical consultant with The Analysis Factor, a stats mentor for Statistically Speaking membership, and a workshop instructor. Read more about Jeff here.

Poisson and Negative Binomial Regression for Count Data
Learn when you need to use Poisson or Negative Binomial Regression in your analysis, how to interpret the results, and how they differ from similar models.

Tagged With: count model, negative binomial, overdispersion, poisson

Related Posts

  • Poisson or Negative Binomial? Using Count Model Diagnostics to Select a Model
  • The Importance of Including an Exposure Variable in Count Models
  • The Problem with Linear Regression for Count Data
  • Analyzing Zero-Truncated Count Data: Length of Stay in the ICU for Flu Victims

Reader Interactions

Leave a Reply Cancel reply

Your email address will not be published. Required fields are marked *

Please note that, due to the large number of comments submitted, any questions on problems related to a personal study/project will not be answered. We suggest joining Statistically Speaking, where you have access to a private forum and more resources 24/7.

Primary Sidebar

This Month’s Statistically Speaking Live Training

  • January Member Training: A Gentle Introduction To Random Slopes In Multilevel Models

Upcoming Workshops

  • Logistic Regression for Binary, Ordinal, and Multinomial Outcomes (May 2021)
  • Introduction to Generalized Linear Mixed Models (May 2021)

Read Our Book


Data Analysis with SPSS
(4th Edition)

by Stephen Sweet and
Karen Grace-Martin

Statistical Resources by Topic

  • Fundamental Statistics
  • Effect Size Statistics, Power, and Sample Size Calculations
  • Analysis of Variance and Covariance
  • Linear Regression
  • Complex Surveys & Sampling
  • Count Regression Models
  • Logistic Regression
  • Missing Data
  • Mixed and Multilevel Models
  • Principal Component Analysis and Factor Analysis
  • Structural Equation Modeling
  • Survival Analysis and Event History Analysis
  • Data Analysis Practice and Skills
  • R
  • SPSS
  • Stata

Copyright © 2008–2021 The Analysis Factor, LLC. All rights reserved.
877-272-8096   Contact Us

The Analysis Factor uses cookies to ensure that we give you the best experience of our website. If you continue we assume that you consent to receive cookies on all websites from The Analysis Factor.
Continue Privacy Policy
Privacy & Cookies Policy

Privacy Overview

This website uses cookies to improve your experience while you navigate through the website. Out of these, the cookies that are categorized as necessary are stored on your browser as they are essential for the working of basic functionalities of the website. We also use third-party cookies that help us analyze and understand how you use this website. These cookies will be stored in your browser only with your consent. You also have the option to opt-out of these cookies. But opting out of some of these cookies may affect your browsing experience.
Necessary
Always Enabled

Necessary cookies are absolutely essential for the website to function properly. This category only includes cookies that ensures basic functionalities and security features of the website. These cookies do not store any personal information.

Non-necessary

Any cookies that may not be particularly necessary for the website to function and is used specifically to collect user personal data via analytics, ads, other embedded contents are termed as non-necessary cookies. It is mandatory to procure user consent prior to running these cookies on your website.