• Skip to primary navigation
  • Skip to main content
  • Skip to primary sidebar
The Analysis Factor

The Analysis Factor

Statistical Consulting, Resources, and Statistics Workshops for Researchers

  • Home
  • Our Programs
    • Membership
    • Online Workshops
    • Free Webinars
    • Consulting Services
  • About
    • Our Team
    • Our Core Values
    • Our Privacy Policy
    • Employment
    • Collaborate with Us
  • Statistical Resources
  • Contact
  • Blog
  • Login

Analyzing Zero-Truncated Count Data: Length of Stay in the ICU for Flu Victims

by Jeff Meyer 3 Comments

by Jeff Meyer

It’s that time of year: flu season.

Let’s imagine you have been asked to determine the factors that will help a hospital determine the length of stay in the intensive care unit (ICU) once a patient is admitted.

The hospital tells you that once the patient is admitted to the ICU, he or she has a day count of one. As soon as they spend 24 hours plus 1 minute, they have stayed an additional day.

Clearly this is count data. There are no fractions, only whole numbers.

To help us explore this analysis, let’s look at real data from the State of Illinois. We know the patients’ ages, gender, race and type of hospital (state vs. private).

A partial frequency distribution looks like this:


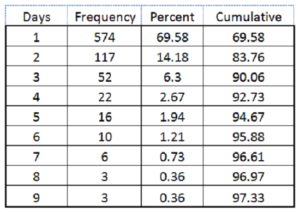
90% of those admitted to the ICU are discharged within 3 days.

But there are patients that stay quite a few days. What are the characteristics of those patients that stay longer?

To find out, we run a linear regression using the predictors mentioned above and get the following results:


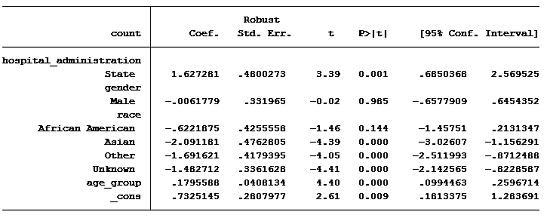
We see that we have a number of significant predictors.

We tell the hospital we can figure out how long a patient might stay in the ICU, and we create a histogram of the expected length of stay:

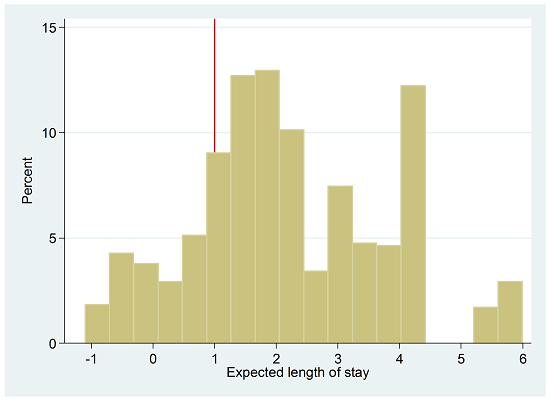
We notice there are quite a few patients that stay less than 1 day: 167 out of 818 observations (20%). But we know that can’t be right.

What went wrong?

You can’t use a linear regression on truncated data. If you do, you will get bad results.

We’ll discuss truncated count models in module 4 of our upcoming workshop, Analyzing Count Data: Poisson, Negative Bimonial, and Other Essential Models.


Jeff Meyer is a statistical consultant with The Analysis Factor, a stats mentor for Statistically Speaking membership, and a workshop instructor. Read more about Jeff here.

Poisson and Negative Binomial Regression for Count Data
Learn when you need to use Poisson or Negative Binomial Regression in your analysis, how to interpret the results, and how they differ from similar models.

Tagged With: Count data, linear regression, negative binomial, poisson, predictors, Truncated

Related Posts

  • The Problem with Linear Regression for Count Data
  • The Importance of Including an Exposure Variable in Count Models
  • Poisson or Negative Binomial? Using Count Model Diagnostics to Select a Model
  • Getting Accurate Predicted Counts When There Are No Zeros in the Data

Reader Interactions

Comments

  1. Ehjas says

    February 16, 2021 at 4:44 am

    I intend to use the above frequency data collected by you for my study purpose. So I am interested to know more about this type of data. Can I please get the source of the above frequency data?
    I await your immediate response.

    Reply
  2. Ehjas Aslam says

    February 15, 2021 at 12:48 pm

    Hi
    Can I please get the source of the above frequency data?
    (Because I need more information about these data)

    Thanking You

    Reply
    • Jeff Meyer says

      February 16, 2021 at 8:13 am

      Hi,
      This data is from the Illinois Department of Public Health. You should be able to find their data online.

      Jeff

      Reply

Leave a Reply Cancel reply

Your email address will not be published. Required fields are marked *

Please note that, due to the large number of comments submitted, any questions on problems related to a personal study/project will not be answered. We suggest joining Statistically Speaking, where you have access to a private forum and more resources 24/7.

Primary Sidebar

This Month’s Statistically Speaking Live Training

  • Member Training: Analyzing Pre-Post Data

Upcoming Free Webinars

Poisson and Negative Binomial Regression Models for Count Data

Upcoming Workshops

  • Analyzing Count Data: Poisson, Negative Binomial, and Other Essential Models (Jul 2022)
  • Introduction to Generalized Linear Mixed Models (Jul 2022)

Copyright © 2008–2022 The Analysis Factor, LLC. All rights reserved.
877-272-8096   Contact Us

The Analysis Factor uses cookies to ensure that we give you the best experience of our website. If you continue we assume that you consent to receive cookies on all websites from The Analysis Factor.
Continue Privacy Policy
Privacy & Cookies Policy

Privacy Overview

This website uses cookies to improve your experience while you navigate through the website. Out of these, the cookies that are categorized as necessary are stored on your browser as they are essential for the working of basic functionalities of the website. We also use third-party cookies that help us analyze and understand how you use this website. These cookies will be stored in your browser only with your consent. You also have the option to opt-out of these cookies. But opting out of some of these cookies may affect your browsing experience.
Necessary
Always Enabled
Necessary cookies are absolutely essential for the website to function properly. This category only includes cookies that ensures basic functionalities and security features of the website. These cookies do not store any personal information.
Non-necessary
Any cookies that may not be particularly necessary for the website to function and is used specifically to collect user personal data via analytics, ads, other embedded contents are termed as non-necessary cookies. It is mandatory to procure user consent prior to running these cookies on your website.
SAVE & ACCEPT