• Skip to primary navigation
  • Skip to main content
  • Skip to primary sidebar
The Analysis Factor

The Analysis Factor

Statistical Consulting, Resources, and Statistics Workshops for Researchers

  • Home
  • About
    • Our Programs
    • Our Team
    • Our Core Values
    • Our Privacy Policy
    • Employment
    • Guest Instructors
  • Membership
    • Statistically Speaking Membership Program
    • Login
  • Workshops
    • Online Workshops
    • Login
  • Consulting
    • Statistical Consulting Services
    • Login
  • Free Webinars
  • Contact
  • Login

R is Not So Hard! A Tutorial, Part 12: Creating Histograms & Setting Bin Widths

by guest 2 Comments

by David Lillis, Ph.D.

This is Part 12 in my R Tutorial Series: R is Not so Hard.  Go back to Part 11 or start with Part 1.

I’m sure you’ve heard that R creates beautiful graphics.

It’s true, and it doesn’t have to be hard to do so.  Let’s start with a simple histogram using the hist() command, which is easy to use, but actually quite sophisticated.

First, we set up a vector of numbers and then we create a histogram.

B <- c(2, 4, 5, 7, 12, 14, 16)
hist(B)

image001

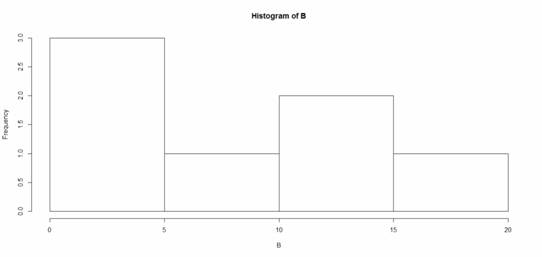
That was easy, but you need more from your histogram. Note that R decided on an appropriate bin width. OK. Now we create a histogram from all the data in an array.

A <- structure(list(James = c(1L, 3L, 6L, 4L, 9L), Robert = c(2L, 5L,
4L, 5L, 12L), David = c(4L, 4L, 6L, 6L, 16L), Anne = c(3L, 5L,
6L, 7L, 6L)), .Names = c("James", "Robert", "David", "Anne"), class = "data.frame", row.names = c(NA, -5L))
attach(A)
A
  James Robert David Anne
1     1      2     4    3
2     3      5     4    5
3     6      4     6    6
4     4      5     6    7
5     9     12    16    6

The trick is to transform the four variables into a single vector and make a histogram of all elements.

B <- c(A$James, A$Robert, A$David, A$Anne)
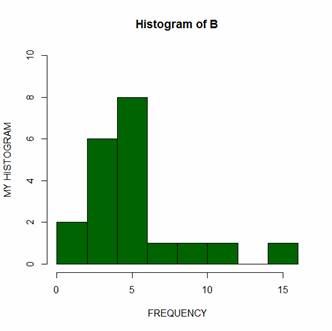
Let’s create a histogram of B in dark green and include axis labels.
hist(B, col="darkgreen", ylim=c(0,10), ylab ="MY HISTOGRAM", xlab
="FREQUENCY")

image002

However, controlling bin numbers can be problematic. Try setting the number of bins at 6 using the breaks argument.

hist(B, col = "red", breaks=6, xlim=c(0,max),
main="My Histogram", las=2, xlab = "Values", cex.lab = 1.3)

image003

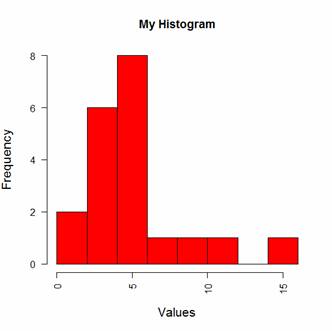
You can see that R has taken the number of bins (6) as indicative only. However, setting up histogram bins as a vector gives you more control over the output. Now we set up the bins as a vector, each bin four units wide, and starting at zero.

bins<- c(0, 4, 8, 12, 16)
hist(B, col = "blue", breaks=bins, xlim=c(0,max),
main="My Histogram", las=2, xlab = "Values", cex.lab = 1.3)

image004

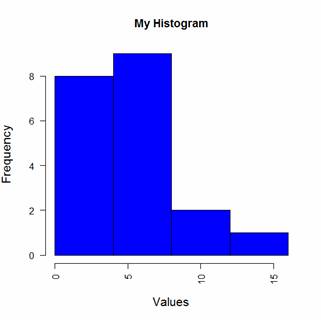
Now we have four bins of the right width. That wasn’t so hard! In Part 13 we will look at further plotting techniques in R.

About the Author: David Lillis has taught R to many researchers and statisticians. His company, Sigma Statistics and Research Limited, provides both on-line instruction and face-to-face workshops on R, and coding services in R. David holds a doctorate in applied statistics.

Bookmark and Share

Tagged With: graphics, histogram, R, statistics

Related Posts

  • R Is Not So Hard! A Tutorial, Part 13: Box Plots
  • R is Not So Hard! A Tutorial, Part 22: Creating and Customizing Scatter Plots
  • R is Not So Hard! A Tutorial, Part 21: Pearson and Spearman Correlation
  • What R Commander Can do in R Without Coding–More Than You Would Think

Reader Interactions

Comments

  1. JFS says

    February 1, 2017 at 5:51 pm

    Again, the table does not read in right using “attach”–maybe it’s due to an R update, or to being on a Mac. But given that the prior one didn’t read in correctly even after jumping through hoops… is there an update needed, or something mac specific?

    Here’s what copy-paste gives; it looks like it might be a problem with the tab (or spaces) between the first two columns, which might be handled differently using a mac?:

    > A
    James Robert David Anne
    1 1 2 4 3
    2 3 5 4 5
    3 6 4 6 6
    4 4 5 6 7
    5 9 12 16 6
    > James Robert David Anne
    Error: unexpected symbol in ” James Robert”
    > 1 1 2 4 3
    Error: unexpected numeric constant in “1 1”
    > 2 3 5 4 5
    Error: unexpected numeric constant in “2 3”
    > 3 6 4 6 6
    Error: unexpected numeric constant in “3 6”
    > 4 4 5 6 7
    Error: unexpected numeric constant in “4 4”
    > 5 9 12 16 6
    Error: unexpected numeric constant in “5 9”

    Reply
  2. Mayur says

    February 18, 2016 at 6:37 pm

    R may not be a good choice for sercah engine optimisation, but they’ve overcome it, I sercahed for R on Google and it was the first result.I’m frustrated with normal stats programs (in some respects, in others I love them), and I’m doing a 3 day R course to see if it can scratch my statistical itch. I’m looking forwards to it, the last time I used a programming language was BASIC in the mid 90s.

    Reply

Leave a Reply Cancel reply

Your email address will not be published. Required fields are marked *

Please note that, due to the large number of comments submitted, any questions on problems related to a personal study/project will not be answered. We suggest joining Statistically Speaking, where you have access to a private forum and more resources 24/7.

Primary Sidebar

Free Webinars

Binary, Ordinal, and Multinomial Logistic Regression for Categorical Outcomes (Signup)

This Month’s Statistically Speaking Live Training

  • April Member Training: Statistical Contrasts

Upcoming Workshops

  • Logistic Regression for Binary, Ordinal, and Multinomial Outcomes (May 2021)
  • Introduction to Generalized Linear Mixed Models (May 2021)

Read Our Book


Data Analysis with SPSS
(4th Edition)

by Stephen Sweet and
Karen Grace-Martin

Statistical Resources by Topic

  • Fundamental Statistics
  • Effect Size Statistics, Power, and Sample Size Calculations
  • Analysis of Variance and Covariance
  • Linear Regression
  • Complex Surveys & Sampling
  • Count Regression Models
  • Logistic Regression
  • Missing Data
  • Mixed and Multilevel Models
  • Principal Component Analysis and Factor Analysis
  • Structural Equation Modeling
  • Survival Analysis and Event History Analysis
  • Data Analysis Practice and Skills
  • R
  • SPSS
  • Stata

Copyright © 2008–2021 The Analysis Factor, LLC. All rights reserved.
877-272-8096   Contact Us

The Analysis Factor uses cookies to ensure that we give you the best experience of our website. If you continue we assume that you consent to receive cookies on all websites from The Analysis Factor.
Continue Privacy Policy
Privacy & Cookies Policy

Privacy Overview

This website uses cookies to improve your experience while you navigate through the website. Out of these, the cookies that are categorized as necessary are stored on your browser as they are essential for the working of basic functionalities of the website. We also use third-party cookies that help us analyze and understand how you use this website. These cookies will be stored in your browser only with your consent. You also have the option to opt-out of these cookies. But opting out of some of these cookies may affect your browsing experience.
Necessary
Always Enabled

Necessary cookies are absolutely essential for the website to function properly. This category only includes cookies that ensures basic functionalities and security features of the website. These cookies do not store any personal information.

Non-necessary

Any cookies that may not be particularly necessary for the website to function and is used specifically to collect user personal data via analytics, ads, other embedded contents are termed as non-necessary cookies. It is mandatory to procure user consent prior to running these cookies on your website.

SAVE & ACCEPT