As it has been said a picture is worth a thousand words and so it is with graphics too.  A well constructed graph can summarize information collected from tens to hundreds or even thousands of data points. But not every graph has the same power to convey complex information clearly. (more…)
graphics
Member Training: An Introduction into the Grammar of Graphics
June 1st, 2021 by TAF SupportMember Training: How to Avoid Common Graphical Mistakes
December 1st, 2019 by guest contributer
Good graphs are extremely powerful tools for communicating quantitative information clearly and accurately.
Unfortunately, many of the graphs we see today confuse, mislead, or deceive the reader.
These poor graphs result from two key limitations. One is a graph designer who isn’t familiar with the principles of effective graphs. The other is software with a poor choice of default settings.
R Is Not So Hard! A Tutorial, Part 14: Pie Charts
March 27th, 2014 by David Lillis In Part 14, let’s see how to create pie charts in R. Let’s create a simple pie chart using the pie() command. As always, we set up a vector of numbers and then we plot them.
B <- c(2, 4, 5, 7, 12, 14, 16) (more…)
R Is Not So Hard! A Tutorial, Part 13: Box Plots
March 17th, 2014 by David LillisIn Part 13, let’s see how to create box plots in R. Let’s create a simple box plot using the boxplot() command, which is easy to use. First, we set up a vector of numbers and then we plot them.
Box plots can be created for individual variables or for variables by group (more…)
R is Not So Hard! A Tutorial, Part 12: Creating Histograms & Setting Bin Widths
March 7th, 2014 by David Lillis
I’m sure you’ve heard that R creates beautiful graphics.
It’s true, and it doesn’t have to be hard to do so. Let’s start with a simple histogram using the hist() command, which is easy to use, but actually quite sophisticated.
First, we set up a vector of numbers and then we create a histogram.
B <- c(2, 4, 5, 7, 12, 14, 16)
hist(B)
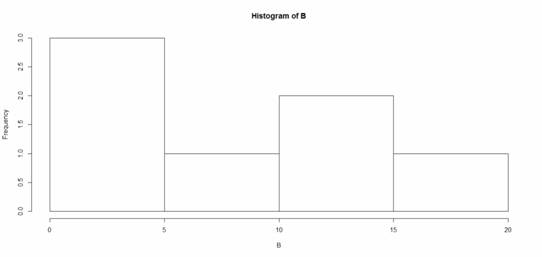
That was easy, but you need more from your histogram. (more…)