 In Part 14, let’s see how to create pie charts in R. Let’s create a simple pie chart using the pie() command. As always, we set up a vector of numbers and then we plot them.
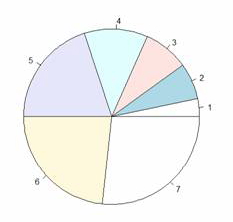
B <- c(2, 4, 5, 7, 12, 14, 16)
Create a simple pie chart.
pie(B)
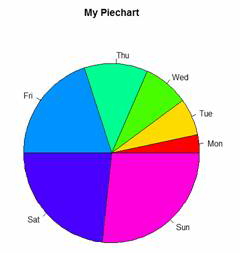
Now let’s create a pie chart with a heading, using nice colours, and define our own labels using R’s rainbow palette. We control the number of colours using length(B).
B <- c(2, 4, 5, 7, 12, 14, 16)
pie(B, main="My Piechart", col=rainbow(length(B)),
labels=c("Mon","Tue","Wed","Thu","Fri","Sat","Sun"))
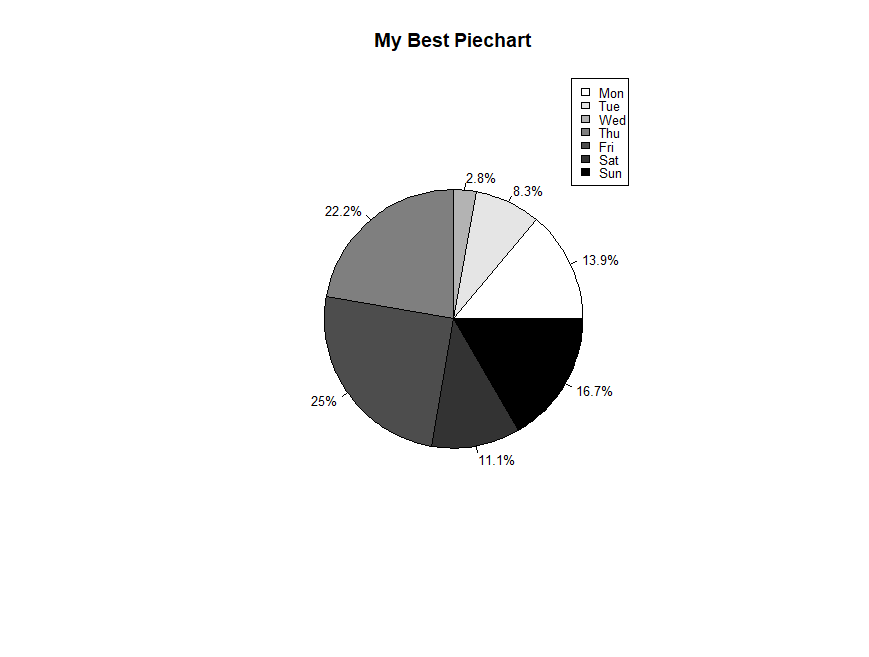
Here is a more complex example, using percentages and a legend. We create a vector of data, one for each day of the week
B <- c(5, 3, 1, 8, 9, 4, 6)
Set up black, grey and white for clear printing.
cols <- c("white","grey90","grey70","grey50","grey30","grey20","black")
Calculate the percentage for each day, using one decimal place.
percentlabels<- round(100*B/sum(B), 1)
Add a ‘%’ sign to each percentage value using the paste command.
pielabels<- paste(percentlabels, "%", sep="")
What does the paste command do?
pie(B, main="My Best Piechart", col=cols, labels=pielabels, cex=0.8)
Create a legend at the right.
legend("topright", c("Mon","Tue","Wed","Thu","Fri","Sat","Sun"), cex=0.8, fill=cols)
Here is your pie chart:
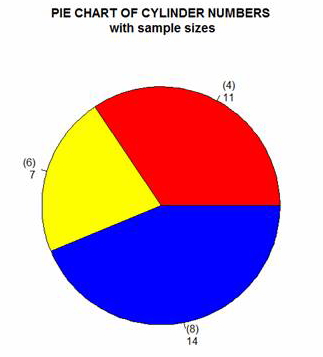
OK. Now let’s create a pie chart from a data frame and include sample sizes. First create a table of counts of cylinder numbers from the mtcars data set.
cyltable<- table(mtcars$cyl)
cyltable
4 6 8
11 7 14
We have eleven cars with four cylinders, seven cars with six cylinders, and fourteen cars with eight cylinders.
Now we create labels.
labs<- paste("(",names(cyltable),")", "\n", cyltable, sep="")
Now we plot.
pie(cyltable, labels = labs, col = c("red", "yellow", "blue"),

main="PIE CHART OF CYLINDER NUMBERS\n with sample sizes")
That wasn’t so hard! In Part 15 we will look at further plotting techniques in R.
About the Author: David Lillis has taught R to many researchers and statisticians. His company, Sigma Statistics and Research Limited, provides both on-line instruction and face-to-face workshops on R, and coding services in R. David holds a doctorate in applied statistics.
See our full R Tutorial Series and other blog posts regarding R programming.
How do you get the labels inside the pie chart instead of outside?
Yeah, after reading this article I realized that it is easy to learn R. Thanks for posting such types of articles and motivating us to learn R Language.
How do you combine the names (labels) and the percentages (relative frequencies) on the graphs?
Awesome instruction. Real easy and effective to see how R works. I pasted your coding into Wordpad, cleaned out the notes, and pasted it straight into R and saw instantaneous results. Beautiful.