• Skip to primary navigation
  • Skip to main content
  • Skip to primary sidebar
The Analysis Factor

The Analysis Factor

Statistical Consulting, Resources, and Statistics Workshops for Researchers

  • Home
  • About
    • Our Programs
    • Our Team
    • Our Core Values
    • Our Privacy Policy
    • Employment
    • Guest Instructors
  • Membership
    • Statistically Speaking Membership Program
    • Login
  • Workshops
    • Online Workshops
    • Login
  • Consulting
    • Statistical Consulting Services
    • Login
  • Free Webinars
  • Contact
  • Login

histogram

November Member Training: Preparing to Use (and Interpret) a Linear Regression Model

by TAF Support

You think a linear regression might be an appropriate statistical analysis for your data, but you’re not entirely sure. What should you check before running your model to find out?

[Read more…] about November Member Training: Preparing to Use (and Interpret) a Linear Regression Model

Tagged With: Bivariate Statistics, histogram, interpreting regression coefficients, linear regression, Multiple Regression, scatterplot, Univariate statistics

Related Posts

  • Member Training: Using Transformations to Improve Your Linear Regression Model
  • Member Training: Segmented Regression
  • The General Linear Model, Analysis of Covariance, and How ANOVA and Linear Regression Really are the Same Model Wearing Different Clothes
  • Interpreting Lower Order Coefficients When the Model Contains an Interaction

What R Commander Can do in R Without Coding–More Than You Would Think

by Karen Grace-Martin 4 Comments

I received a question recently about R Commander, a free R package.  R Commander is the powerhouse of our upcoming workshop R for SPSS Users.

R Commander overlays a menu-based interface to R, so just like SPSS or JMP, you can run analyses using menus.  Nice, huh?

The question was whether R Commander does everything R does, or just a small subset.

Unfortunately, R Commander can’t do everything R does. Not even close.

But it does a lot. More than just the basics.

So I thought I would show you some of the things R Commander can do entirely through menus–no programming required, just so you can see just how unbelievably useful it is.

Data Sets and Variables

Import data sets from other software:

  • SPSS
  • Stata
  • Excel
  • Minitab
  • Text
  • SAS Xport

Define Numerical Variables as categorical and label the values

Open the data sets that come with R packages

Merge Data Sets

Edit and show the data in a data spreadsheet

Personally, I think that if this was all R Commander did, it would be incredibly useful. These are the types of things I just cannot remember all the commands for, since I just don’t use R often enough.

Data Analysis

Yes, R Commander does many of the simple statistical tests you’d expect:

  • Chi-square tests
  • Paired and Independent Samples t-tests
  • Tests of Proportions
  • Common nonparametrics, like Friedman, Wilcoxon, and Kruskal-Wallis tests
  • One-way ANOVA and simple linear regression

What is surprising though, is how many higher-level statistics and models it runs:

  • Hierarchical and K-Means Cluster analysis (with 7 linkage methods and 4 options of distance measures)
  • Principal Components and Factor Analysis
  • Linear Regression (with model selection, influence statistics, and multicollinearity diagnostic options, among others)
  • Logistic regression for binary, ordinal, and multinomial responses
  • Generalized linear models, including Gamma and Poisson models

In other words–you can use R Commander to run in R most of the analyses that most researchers need.

Graphs

A sample of the types of graphs R Commander creates in R without you having to write any code:

  • QQ Plots
  • Scatter plots
  • Histograms
  • Box Plots
  • Bar Charts

The nice part is that it does not only do simple versions of these plots.  You can, for example, add regression lines to a scatter plot or run histograms by a grouping factor.

Tagged With: box plot, cluster analysis, generalized linear models, histogram, linear regression, logistic regression, principal component analysis, R, Rcommander, scatterplot

Related Posts

  • Generalized Linear Models in R, Part 5: Graphs for Logistic Regression
  • Generalized Linear Models (GLMs) in R, Part 4: Options, Link Functions, and Interpretation
  • R Is Not So Hard! A Tutorial, Part 13: Box Plots
  • R is Not So Hard! A Tutorial, Part 12: Creating Histograms & Setting Bin Widths

R is Not So Hard! A Tutorial, Part 12: Creating Histograms & Setting Bin Widths

by guest 2 Comments

by David Lillis, Ph.D.

This is Part 12 in my R Tutorial Series: R is Not so Hard.  Go back to Part 11 or start with Part 1.

I’m sure you’ve heard that R creates beautiful graphics.

It’s true, and it doesn’t have to be hard to do so.  Let’s start with a simple histogram using the hist() command, which is easy to use, but actually quite sophisticated.

First, we set up a vector of numbers and then we create a histogram.

B <- c(2, 4, 5, 7, 12, 14, 16)
hist(B)

image001

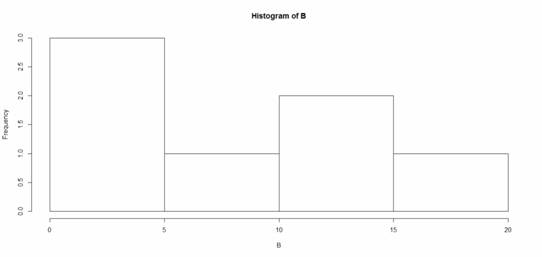
That was easy, but you need more from your histogram. [Read more…] about R is Not So Hard! A Tutorial, Part 12: Creating Histograms & Setting Bin Widths

Tagged With: graphics, histogram, R, statistics

Related Posts

  • R Is Not So Hard! A Tutorial, Part 13: Box Plots
  • R is Not So Hard! A Tutorial, Part 22: Creating and Customizing Scatter Plots
  • R is Not So Hard! A Tutorial, Part 21: Pearson and Spearman Correlation
  • What R Commander Can do in R Without Coding–More Than You Would Think

Primary Sidebar

Free Webinars

Effect Size Statistics on Tuesday, Feb 2nd

This Month’s Statistically Speaking Live Training

  • January Member Training: A Gentle Introduction To Random Slopes In Multilevel Models

Upcoming Workshops

  • Logistic Regression for Binary, Ordinal, and Multinomial Outcomes (May 2021)
  • Introduction to Generalized Linear Mixed Models (May 2021)

Read Our Book


Data Analysis with SPSS
(4th Edition)

by Stephen Sweet and
Karen Grace-Martin

Statistical Resources by Topic

  • Fundamental Statistics
  • Effect Size Statistics, Power, and Sample Size Calculations
  • Analysis of Variance and Covariance
  • Linear Regression
  • Complex Surveys & Sampling
  • Count Regression Models
  • Logistic Regression
  • Missing Data
  • Mixed and Multilevel Models
  • Principal Component Analysis and Factor Analysis
  • Structural Equation Modeling
  • Survival Analysis and Event History Analysis
  • Data Analysis Practice and Skills
  • R
  • SPSS
  • Stata

Copyright © 2008–2021 The Analysis Factor, LLC. All rights reserved.
877-272-8096   Contact Us

The Analysis Factor uses cookies to ensure that we give you the best experience of our website. If you continue we assume that you consent to receive cookies on all websites from The Analysis Factor.
Continue Privacy Policy
Privacy & Cookies Policy

Privacy Overview

This website uses cookies to improve your experience while you navigate through the website. Out of these, the cookies that are categorized as necessary are stored on your browser as they are essential for the working of basic functionalities of the website. We also use third-party cookies that help us analyze and understand how you use this website. These cookies will be stored in your browser only with your consent. You also have the option to opt-out of these cookies. But opting out of some of these cookies may affect your browsing experience.
Necessary
Always Enabled

Necessary cookies are absolutely essential for the website to function properly. This category only includes cookies that ensures basic functionalities and security features of the website. These cookies do not store any personal information.

Non-necessary

Any cookies that may not be particularly necessary for the website to function and is used specifically to collect user personal data via analytics, ads, other embedded contents are termed as non-necessary cookies. It is mandatory to procure user consent prior to running these cookies on your website.