Ever hear this rule of thumb: “The Chi-Square test is invalid if we have fewer than 5 observations in a cell”.
I frequently hear this mis-understood and incorrect “rule.”
We all want rules of thumb even though we know they can be wrong, misleading, or misinterpreted.
Rules of Thumb are like Urban Myths or like a bad game of ‘Telephone’. The actual message gets totally distorted over time.
So what is the correct message here?
The correct statement is not about the actual number of observations in each cell. Those can be fewer than 5. It’s the expected number of observations that needs to be > 5 per cell*.
Why is this important?
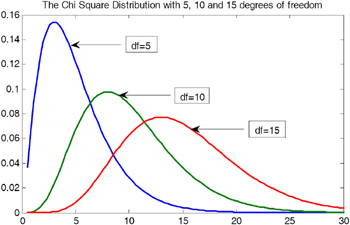
The Chi-square statistic follows a chi-square distribution asymptotically with df=n-1. That means we can use the chi-square distribution to calculate an accurate p-value only for large samples. (That’s where the asymptotically comes in). For small samples, it doesn’t work.
How Many Observations Does a Chi-Square Test Need?
One that is large enough that the expected value for each cell is at least 5. Those expected values come from the total sample size, and the corresponding total frequencies of each row and column. So if any row or column totals in your contingency table are small, or together are relatively small, you’ll have an expected value that’s too low.
Software packages typically supply a warning when this occurs. For example, it’s the criterion SAS uses.
Look at the table below, which shows observed counts between two categorical variables, A and B. The observed counts are the actual data. You can see that out of a total sample size of 48, 28 are in the B1 category and 20 are in the B2 category.
Likewise, 33 are in the A1 category and 15 are in the A2 category. Inside the box are the individual cells, which give the counts for each combination of the two A categories and two B categories.
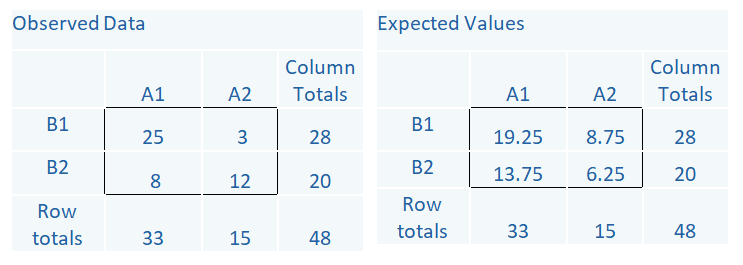
The Expected counts come from the row totals, column totals and the overall total, 48. For example, in the A2, B1 cell, we expect a count of 8.75. It is an easy calculation: (Row Total * Column Total)/Total. So (28*15)/48.
The more different the observed and expected counts are from each other, the larger the chi-square statistic.
Notice in the Observed Data there is a cell with a count of 3. But the expected counts are all >5. If the expected counts are less than 5 then a different test should be used (e.g. Fisher’s Exact Test).
But is 5 the true minimum?
There are other suggested guidelines too.
According to Cochran (1952, 1954), all expected counts should be 10 or greater. If < 10, but >=5, Yates’ Correction for continuity should be applied.
More recent standards for a 2 x 2 Table (Campbell 2007) say Fisher’s Exact and Yates Correction are too conservative and proposes alternative tests depending on the study design.
For tables larger than 2 x 2 Yates, Moore & McCabe (1999), state “No more than 20% of the expected counts should be less than 5 and all individual expected counts should be greater or equal to 1. Some expected counts can be <5, provided none <1, and 80% of the expected counts should be equal to or greater than 5.”
The Minitab manual criteria are: If either variable has only 2 or 3 categories, then either
— all cells must have expected counts of at least 3 or
— all cells must have expected counts of at least 2 and 50% or fewer have expected counts below 5
If both variables have 4 to 6 levels then either:
— all cells have expected counts of at least 2, or
— all cells have expected counts of at least 1 and 50% or fewer cells have expected counts of < 5
In summary, different sources have different criteria for the Chi-square test to be valid. All criteria refer to the expected cell counts and not the observed data.
There are alternative tests for small cell counts such as Fisher’s Exact Test and Yates correction. Lastly, sometimes it might be necessary to collapse across categories to obtain adequate cell counts.
*The ‘5’ probably came from Fisher.

Thanks for this clear summary !
Is it possible to have the full references for the cited sources in this article ?
Don’t find the article of Campell, 2007.
I wish you said more about Upper limit for the sample size.
It would seem that as the sample size increases the test is more likely to reject H0, since even the smallest difference at small sample size will be bigger as the sample size grows. and since the ChiSquared table does not account for sample size it will not be able to cope with sample size of 2000 🙂
Arek, yes, this is true. As the sample size increases, the test is more likely to reject H0. But that’s true for every single hypothesis test.
What’s different here is that if the sample size is too small, the Chi-square distribution doesn’t fit as a way of even calculating an accurate p-value.
Thank you for this refresher on the chi-square and some newer alternatives for its implementation.
Nice summary, Audrey. But I wish you had said a bit more about Campbell’s (2007) nice simulation study. His recommendations (plus much more information) about the N-1 Chi-square test can be found here:
https://www.iancampbell.co.uk/twobytwo/twobytwo.htm
SPSS users may be interested to know that the test of linear-by-linear association (from CROSSTABS) is equivalent to the N-1 Chi-square when you have a 2×2 table. It can also be calculated as (N-1)r^2. See these notes by the late David Howell, for example:
https://www.uvm.edu/~statdhtx/StatPages/More_Stuff/OrdinalChisq/OrdinalChiSq.html
Cheers,
Bruce
Thanks for posting this very clear discussion.
This was helpful revision of the chi square test Thank you so much
Thank you for your tutorial on Chisquare analysis using SPSS.
I have 2 questions
1. I have 4 groups and 3 variables. Chisquare analysis shows significant association. Is there a post hoc test I can do after this or should I separately compare two groups? It will be 2X3 6 times
2. What do I do if the number of observations is less than 5 for some of the responses. Since it is 3 responses, I cannot use Fisher’s exact and I do not want to collapse the reponses into two.
Thanks in advance
with regards