A number of years ago when I was still working in the consulting office at Cornell, someone came in asking for help interpreting their ordinal logistic regression results.
The client was surprised because all the coefficients were backwards from what they expected, and they wanted to make sure they were interpreting them correctly.
It looked like the researcher had done everything correctly, but the results were definitely bizarre. They were using SPSS and the manual wasn’t clarifying anything for me, so I did the logical thing: I ran it in another software program. I wanted to make sure the problem was with interpretation, and not in some strange default or mistake in running the program.
I used Minitab. Lo and behold, most of the parameter estimates were identical, but with signs opposite those from SPSS.
Now, if all of them had reversed sign, it would have been a simple matter of different defaults.
But the intercept was the same in both packages. Only the rest of the parameter estimates were backwards.
Curiouser and curiouser.
Luckily, in my office, we had access to at least four different packages, and we found (by now, the whole office was in on solving the mystery) that SPSS and Stata gave us one result and Minitab and SAS gave the other.
Here’s an example of ordinal logistic regression from SPSS and SAS output. For the record, SPSS uses “Threshold” for Intercept:
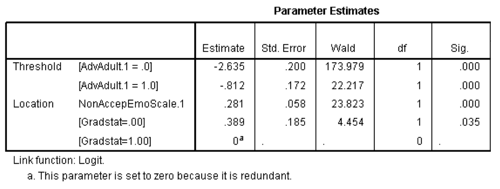
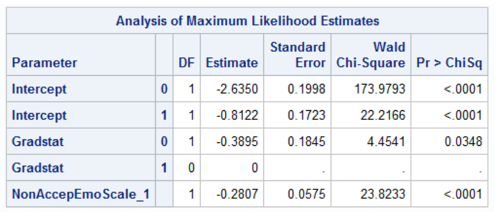
You can see that indeed, all the coefficients (Estimate column) are identical, but with opposite signs. Except the intercepts, which are identical.
Mystery Solved
As it turns out, SPSS and Stata did something clever.
SAS and Minitab parameterize the model in the usual way—the same way any regression model does:

It makes interpretation difficult though, because those Fijs represent cumulative probabilities.
Fi1 is the probability that Y = 1, the lowest ordered category.
Fi2 is the probability that Y ≤ 2, the lowest two ordered categories.
Fi3 is the probability that Y ≤ 3, the lowest three ordered categories, and so on.
Each odds ratio (exp(beta)) represents the factor increase in the odds of moving into a lower ordered category for each one-unit increase in X.
In other words, as X gets bigger, a positive beta means higher odds of a lower ordered category.
That is intuitively backward.
It’s not wrong. It just takes a little bit more thought to keep track of all the directions of all these variables.
To make your life just a little easier, SPSS and Stata run the model this way instead:
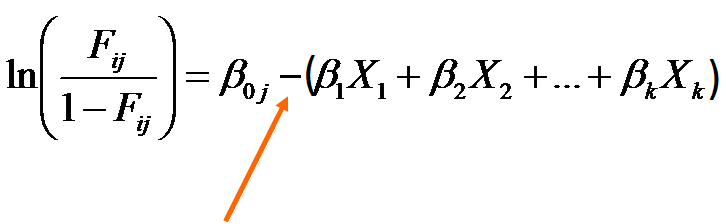
See that very important minus sign? It flips the estimation of all the coefficients other than the intercept.
In this version of the model, positive values of beta indicate higher odds of moving to the next higher ordered category for higher values of X.
Which makes a little more sense.
The lessons:
- Know your software defaults. It was a strange output that led us to look up this one, but not all incorrect results look strange.
- This will also be crucial if you use these results to calculate predicted probabilities.
- Knowing at least two software packages is a huge advantage. It helps you figure out if strange results are a software issue or a statistical one.
- Wow, my job is so fun. (Really).

Dear Madama Karen and Mr Jeremiah,
Thank you very much for your unreserved and consistent scholarly support
Hi Biftu,
You’re welcome! Glad we can help.
I have a project on ordinal logistic regression using spss the how to interprete the result so send me an example with related to this
To obtain OR in SPSS, do we need to compute exp(b) or exp(-b)? I’ve seen these two and I’m a little confused.
Vagner, exp(b). You will still interpret it in the same direction–> higher X leads to more likely higher categories if OR>1
Hi Karen,
glad to read this! By now, I couln’t find a clear answer on how to interpret the estimate (ordinal regression output in SPSS). So am I right, if I take the following stepts
Step 1: Run ordinal regression
Step 2: exp(estimates) to see the influence of the independent variable (?)
My Problem: My linc function is the “complement log log” (because my dependent variable has extreme values in higher categories). So do I have to change the way in step 2?
I remember reading about this back in grad school (I/O Psych) in Tabachnick & Fidel. They compared four different stats programs and noted this issue. Whenever I do logistic regression (not often), I always have to refresh my memory on how to interpret it in SAS.
Hi,
Which version of SAS has this problem. I have a result opposite to what I have expected but I want to be 100 percent confident that this is due to internal SAS programming.
Kind Regards,
Dharmendra
Hi Dharmendra,
It’s not a problem with SAS. It’s just the way they parameterize the model. As far as I know, it’s across all versions.