The expression “can’t see the forest for the trees” often comes to mind when reviewing a statistical analysis. We get so involved in reporting “statistically significant” and p-values that we fail to explore the grand picture of our results.
It’s understandable that this can happen. We have a hypothesis to test. We go through a multi-step process to create the best model fit possible. Too often the next and last step is to report which predictors are statistically significant and include their effect sizes.
I suggest one additional step: take the time to absorb and think about the information you can extract from your model with predicted means.
I use the term “information” because we will not focus on p-values and significance levels. Nor are we summarizing a predictor’s effect simply with a coefficient, but digging deeper into what that coefficient tells us.
In the model below, we are determining which predictors are associated with the number of times someone visits a doctor over a two-week period.
There are four numerical predictors:
Illness — number of days ill
Actdays — number of days not active
Prescrib — number of prescriptions used
Medical_advice — Number of times sought medical advice in past two-weeks
There is one categorical predictor:
the type of medical insurance each person has.
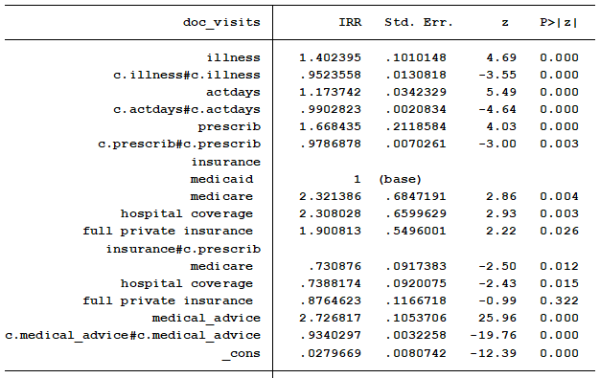
Note that virtually every coefficient is significant. We will report the coefficients, p-values and confidence intervals in the final write up. But the coefficients table doesn’t communicate well what the real effects are. Let’s investigate a bit with some predicted values.
Do people on Medicaid with two and four prescriptions have the same predicted number of trips to the doctor’s office? How does that compare to someone that is on private insurance or Medicare? Do these comparisons differ for people who seek medical an average (.52) or a high (4) number of times?
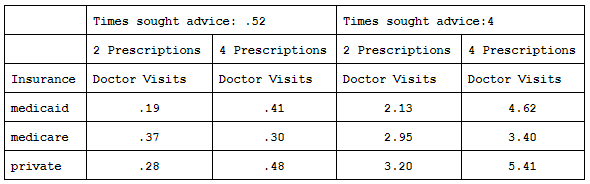
We will start with the left half of the table for people who seek medical advice an average number of times. The predicted number of visits for people with Medicaid and private insurance about doubles when the number of prescriptions they are taking increase from two to four.
People on Medicare have no increase. However, the predicted total number of visits is still less than 0.5 in all situations.
What happens if we change the number of times someone sought medical advice from the mean of 0.52 to 4 times. Let’s look at the right side.
We find that predicted number of doctor visits increases substantially overall. The minimum number of doctor visits is now 2.13. Of people taking two prescriptions, those on Medicaid have the fewest expected visits while those on private insurance have the most.
Interestingly, the predicted number of doctor visits for those on Medicaid more than double while those with Medicare increase only slightly when the number of prescriptions increase from two to four.
The predicted number of doctor visits by people with Medicaid now surpasses those with Medicare. People with full private insurance, who most likely have easier access to see the doctor, remain as the group with the greatest expected number of doctor visits.
Now we have interesting information to give our audience beyond confusing coefficients and p-values. We have brought our numbers and data to life so non-statisticians can learn from our work.
Jeff Meyer is a statistical consultant with The Analysis Factor, a stats mentor for Statistically Speaking membership, and a workshop instructor. Read more about Jeff here.
