by Christos Giannoulis, PhD
Attributes are often measured using multiple variables with different upper and lower limits. For example, we may have five measures of political orientation, each with a different range of values.
Each variable is measured in a different way. The measures have a different number of categories and the low and high scores on each measure are different.
| Low Score | High Score | Variable Name | |
| Trust in Government | 1 | 10 (high trust) | TRUST |
| Political Efficacy | 0 | 4 (high efficacy) | POLEF |
| Feeling towards President | 0 | 100 (positive energy) | LEAD |
| Alienation from politics | 8 | 24 (not alienated) | ALIEN |
| Frequency of reading about politics per week | 0 | 20 (frequent) | POLR |
The different scales of the variables present two important problems.
1. Comparison
It is very difficult to compare across these variables. The usual way of comparing across variables is to calculate the mean for each variable and to compare the means.
However, since each of the variables is measured on a different scale these means will be extremely difficult to compare.
For example, the mean on trust in government might be 4. The mean for alienation might be 10. But because the scales are different length and have different starting points comparisons of means are not meaningful.
Since each question is measured in different units, it is like comparing apples with oranges.
2. Creating Indices
When creating multi-item scales, items that have different lower and upper points will contribute differently to the final multi-item scale score if used in their raw form.
This means that some items will count for more in the computation of a final score. This is usually not what we want.
It is similar to having three pieces of assessment to arrive at a final mark for a subject at a university. One piece of work might be marked out of 80, another out of 10 and another out of 20.
If we simply added up raw scores, then the piece of work marked out of 80 would count for much more in the final mark.
If this is what was desired then all is well, but if each piece of work was meant to contribute equally to the final mark then we would need to adjust the items to equalize the contribution.
How to make Variables more comparable
The solution to these problems is to convert the scales into a common measurement scale so that they can be compared. This can be achieved in two ways:
- Converting each scale to have the same lower and upper levels
- Standardizing the variables and expressing scores at standard deviation units. (z-scores)
You are probably familiar with the latter option, so let me describe the former.
How to Convert Variables to have the same Lower and Upper Limits
This solution involves adjusting the scale on each variable, “stretching” some measures and “squeezing” others. For any numerical scale the conversion is achieved using this formula:
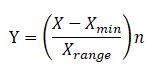
Where Y is the adjusted variable, X is the original variable, Xmin is the minimum observed value on the original variable and Xrange is the difference between the maximum potential score and the minimum potential score on the original variable and n is the upper limit of the rescaled variable.
This conversion can easily be accomplished with a variable transformation in any statistical software.
For example, let’s suppose we want all variables converted to a scale of 0-10. Let us convert POLEF (table above). From the table with see that the minimum potential score was 0, and the maximum observed score was 4. The range therefore is 4. Our formula is thus:
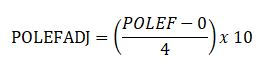
An individual with a score 4 on POLEF would score (4/4) x 10 = 10 on POLEFADJ; a score of 0 on POLEF would convert to (0/4) x 10 = 0 on POLEFADJ, while a score of 2 on POLEF would become a POLEFADJ score on (2/4) x 10 = 5.
Having converted all five variables to a range of 0-10, it becomes much easier to compare scores and averages across them… It may be possible to compare apples and oranges after all!

Hello, thank you for the content. The conversion using upper and lower bounds worked perfectly for my data issue. Could you provide me with some bibliographic reference regarding this method? For example, where is the recommendation for using this formula found?
can you please tell How to Convert Variables to have the same Lower and Upper Limits in SPSS? or in any other statistics software?
Hi!
Thanks for this post. Can you clarify this for me? First you say, where Y is the adjusted variable, X is the original variable, Xmin is the minimum observed value on the original variable and Xrange is the difference between the maximum potential score and the minimum potential score on the original variable and n is the upper limit of the rescaled variable.
But then you give the POLEF example where you use the maximum observed score, as opposed to the minimum observed value noted above. Which should I use, the minimum observed value or maximum observed value?
Thanks!
Hi Alyssa,
In that example, Christos use the maximum value to calculate the Range, which is what is going into the denominator. In that example, 4 is both the maximum and the range, but he’s really using the range.
Dear Christos ,
Thank you very much for the post. I like the former one to rescale different indicators of a variable. I have a further question. Hope you are willing to answer on it.
I have three different indicators to measure a variable. But, one is continuous indicator. Can I still use the former method?
For example,
1. First indicator: 0, 1, 0, 1, 1, 2, 2. (0 ~ 2) *integer number
2. Second indicator: 0, 1, (…) 50 (0 ~ 50) *integer number
3. Third indicator: 0, 0.23, (…), 0.89, 1 (0~1) *continuous indicator
In this case, Can I still use the former method you described?
I look forward your reply. Thank you very much.
Best regards,
Leroy
this works better for me: Y is the new adjusted value of the item response. X is the original item value, range of the new scale, Xmin is the original minimal possible value, and X range is the original range. This is also shown on the IBM SPSS site under their support page: “Transforming different Likert scales to a common scale” .
Y = range of new scale* (X-Xmin)/(Xrange) +1, so going from a 1-4 likert scale to a 1-5 likert scale is:
(5 – 1) * (x – 1) / (4 – 1) + 1 = 4 * (x – 1) / 3 + 1 = (4/3) * x – (4/3) + 1 = (4/3) * x – (1/3)
Why have you added one in the formula?
Y = range of new scale* (X-Xmin)/(Xrange) +1
hi, to use these calculations in research paper we need citation. Can anyone please provide citation for these calculations
Hi
Could you find academic citations for this method? Please share if you did. Thanks.
Hello! I found the the link to the IBM SPSS site where you can find the transformation of Likert scales to a common scale. Hope this helps.
https://www.ibm.com/support/pages/transforming-different-likert-scales-common-scale
Thank you Estefania! That is lifesaver!
What if both scales start at 1 and have different maximums (say one scale has a max of 4 and the other 5)? Wouldnt this make an original 1 into a 0 in the new scale?