SPSS has a nice little feature for adding and averaging variables with  missing data that many people don’t know about.
It allows you to add or average variables that have some missing data, while specifying how many are allowed to be missing. (more…)
In our previous posts, we’ve relied on Stata’s pre-loaded datasets to perform analyses. But when you’re working with your own data, you’ll need to know how to import it into Stata.
To demonstrate how this process works, we will use the Iris dataset from UCI.
Download the dataset, then move it to whichever directory you intend to use for Stata files.
There are three main ways of importing data in Stata: either use the menus to import the data, call the dataset by its full file extension, or change your directory to the one with your data and then refer to the dataset by name. (more…)
Ever consider skipping the important step of cleaning your data? It’s tempting but not a good idea. Why? It’s a bit like baking.
I like to bake. There’s nothing nicer than a rainy Sunday with no plans, and a pantry full of supplies. I have done my shopping, and now it’s time to make the cake. Ah, but the kitchen is a mess. I don’t have things in order. This is no way to start.
First, I need to clear the counter, wash the breakfast dishes, and set out my tools. I need to take stock, read the recipe, and measure out my ingredients. Then it’s time for the fun part. I’ll admit, in my rush to get started I have at times skipped this step.
(more…)
If you’ve been doing data analysis for long, you’ve probably had the ‘AHA’ moment where you realized statistical practice is a craft and not just a science. As with any craft, there are best practices that will save you a lot of pain and suffering and elevate the quality of your work. And yet, it’s likely that no one may have taught you these. I know I never had a class on this. (more…)
by Christos Giannoulis, PhD
Attributes are often measured using multiple variables with different upper and lower limits. For example, we may have five measures of political orientation, each with a different range of values.
Each variable is measured in a different way. The measures have a different number of categories and the low and high scores on each measure are different.
(more…)
Not too long ago, a colleague mentioned that while he does a lot of study design these days, he no longer does much data analysis.
His main reason was that 80% of the work in data analysis is preparing the data for analysis. Data preparation is s-l-o-w and he found that few colleagues and clients understood this.
Consequently, he was running into expectations that he should analyze a raw data set in an hour or so.
You know, by clicking a few buttons.
I see this as well with researchers new to data analysis. While they know it will take longer than an hour, they still have unrealistic expectations about how long it takes.
So I am here to tell you, the time-consuming part is preparing the data. Weeks is a realistic time frame. Hours is not.
(Feel free to send this to your colleagues who want instant results.)
There are three parts to preparing data: cleaning it, creating necessary variables, and formatting all variables.
Data Cleaning
Data cleaning means finding and eliminating errors in the data. How you approach it depends on how large the data set is, but the kinds of things you’re looking for are: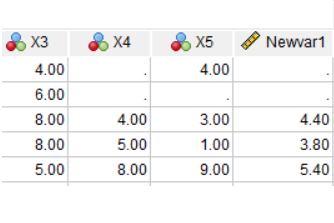
- Impossible or otherwise incorrect values for specific variables
- Cases in the data who met exclusion criteria and shouldn’t be in the study
- Duplicate cases
- Missing data and outliers (don’t delete all outliers, but you may need to investigate to see if one is an error)
- Skip-pattern or logic breakdowns
- Making sure that the same value of string variables is always written the same way (male ≠ Male in most statistical software).
You can’t avoid data cleaning and it always takes a while, but there are ways to make it more efficient. For example, rather than search through the data set for impossible values, print a table of data values outside a normal range, along with subject ids.
This is where learning how to code in your statistical software of choice really helps. You’ll need to subset your data using IF statements to find those impossible values.
But if your data set is anything but small, you can also save yourself a lot of time, code, and errors by incorporating efficiencies like loops and macros so that you can perform some of these checks on many variables at once.
Creating New Variables
Once the data are free of errors, you need to set up the variables that will directly answer your research questions.
It’s a rare data set in which every variable you need is measured directly.
So you may need to do a lot of recoding and computing of variables.
Examples include:
And of course, part of creating each new variable is double-checking that it worked correctly.
Formatting Variables
Both original and newly created variables need to be formatted correctly for two reasons:
First, so your software works with them correctly. Failing to format a missing value code or a dummy variable correctly will have major consequences for your data analysis.
Second, it’s much faster to run the analyses and interpret results if you don’t have to keep looking up which variable Q156 is.
Examples include:
- Setting all missing data codes so missing data are treated as such
- Formatting date variables as dates, numerical variables as numbers, etc.
- Labeling all variables and categorical values so you don’t have to keep looking them up.
All of these steps require a solid knowledge of how to manage data in your statistical software. Each one approaches them a little differently.
It’s also very important to keep track of and be able to easily redo all your steps. Always assume you’ll have to redo something. So use (or record) syntax, not only menus.