 Is it really ok to treat Likert items as continuous?
 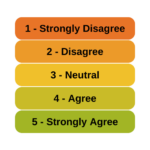 And can you just decide to combine Likert items to make a scale? Likert-type data is extremely common—and so are questions like these about how to analyze it appropriately. (more…)
Correlation
Member Training: Analyzing Likert Scale Data
August 31st, 2022 by TAF SupportSix terms that mean something different statistically and colloquially
November 8th, 2021 by guest contributerby Kim Love and Karen Grace-Martin
Statistics terminology is confusing.
Sometimes different terms are used to mean the same thing, often in different fields of application. Sometimes the same term is used to mean different things. And sometimes very similar terms are used to describe related but distinct statistical concepts.
Member Training: Confusing Statistical Terms
February 28th, 2020 by guest contributer Learning statistics is difficult enough; throw in some especially confusing terminology and it can feel impossible! There are many ways that statistical language can be confusing.
Some terms mean one thing in the English language, but have another (usually more specific) meaning in statistics. (more…)
The Difference Between Association and Correlation
September 10th, 2019 by Karen Grace-MartinWhat does it mean for two variables to be correlated?
Is that the same or different than if they’re associated or related?
This is the kind of question that can feel silly, but shouldn’t. It’s just a reflection of the confusing terminology used in statistics. In this case, the technical statistical term looks like, but is not exactly the same as, the way we mean it in everyday English. (more…)
Member Training: Interpretation of Effect Size Statistics
August 30th, 2019 by guest contributerEffect size statistics are required by most journals and committees these days — for good reason.
They communicate just how big the effects are in your statistical results — something p-values can’t do.
But they’re only useful if you can choose the most appropriate one and if you can interpret it.
This can be hard in even simple statistical tests. But once you get into complicated models, it’s a whole new story. (more…)
Member Training: Those Darn Ratios!
December 1st, 2018 by TAF SupportRatios are everywhere in statistics—coefficient of variation, hazard ratio, odds ratio, the list goes on. You see them reported in the literature and in your output.
You comment on them in your reports. You even (kinda) understand them. Or, maybe, not quite?
Please join Elaine Eisenbeisz as she presents an overview of the how and why of various ratios we use often in statistical practice.