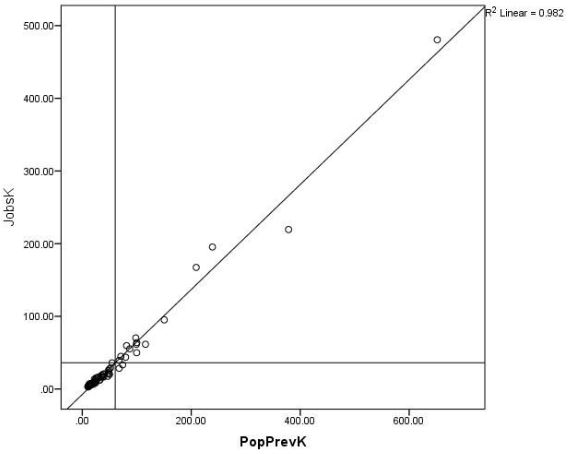
What does it mean for two variables to be correlated?
Is that the same or different than if they’re associated or related?
This is the kind of question that can feel silly, but shouldn’t. It’s just a reflection of the confusing terminology used in statistics. In this case, the technical statistical term looks like, but is not exactly the same as, the way we mean it in everyday English.
In everyday English, correlated, associated, and related all mean the same thing.
The technical meaning of correlation is the strength of association as measured by a correlation coefficient.
While correlation is a technical term, association is not. It simply means the presence of a relationship: certain values of one variable tend to co-occur with certain values of the other variable.
Correlation Coefficients
Correlation coefficients are on a -1 to 1 scale.
On this scale -1 indicates a perfect negative relationship. High values of one variable are associated with low values of the other.
Likewise, a correlation of +1 describes a perfect positive relationship. High values of one variable are associated with high values of the other.
0 indicates no relationship. High values of one variable co-occur as often with high and low values of the other.
There is no independent and no dependent variable in a correlation. It’s a bivariate descriptive statistic.
You can make this descriptive statistic into an inferential one. Simply calculate a confidence interval or run a hypothesis test that the population correlation coefficient = 0. But correlations are inherently descriptive and don’t require a test.
The most common correlation coefficient is the Pearson correlation coefficient. Often denoted by r, it measures the strength of a linear relationship in a sample on a standardized scale from -1 to 1.
It is so common that people use it synonymously with correlation.
Pearson’s coefficient assumes that both variables are normally distributed. This requires they be truly continuous and unbounded.
But if you’re interested in relationships between other variables, don’t worry. There are other correlation coefficients that don’t require normality of the variables.
Examples include Spearman rank correlation, point-biserial correlation, rank-biserial correlation, tetrachoric, and polychoric correlation.
Association, but not Correlation
There are other measures of association that don’t have those exact same properties. They work when one or both of the variables is either ordinal or nominal.
They include measures such as phi, gamma, Kendall’s tau-b, Stuart’s tau-c, Somer’s D, and Cramer’s V, among others.
So to summarize, there are many measures of association, and only some of these are correlations. Even so, there isn’t always consensus about the meanings of terms in statistics, so it’s always a good practice to state the meaning of the terms you’re using.


it was really informative
Absolutely very informative. Statistics requires knowledge renewal over and over.
Just a note that the application of inferential statistics to correlations can include tests of any value or range of values between -1 and 1. If you have some hypothesis about a correlation between two variables, then presumably you will have some idea about what the magnitude of r is, or some range within which r should fall, and therefore you should explicitly test that hypothesis rather than determining whether the value of r is significantly different from zero, unless of course you actually believe that r is zero.
Hi Daniel, yes I agree that if you have a hypothesis about another value than 0, use it in your test.
rho=0 is the “default” hypothesis, though, simply because that’s a common question. Is there evidence of a non-zero correlation?
😉 in the email leading me to this web-page … I noticed the following:
“But in statistics, correlation has a specific technical mean. Curious?”
Yes, I am, because I’m led to believe that only God knows the mean.
Hi Don. haha, that should have said “specific technical meaning.” Other definition of mean.
It was informative and useful.
thanks
Love this one
This is really informative and a wake up call to many of us who use such terms without putting much thought to them.