You may have heard of McNemar tests as a repeated measures version of a chi-square test of independence. This is basically true, and I wanted to show you how these two tests differ and what exactly, each one is testing.
First of all, although Chi-Square tests can be used for larger tables, McNemar tests can only be used for a 2×2 table. So we’re going to restrict the comparison to 2×2 tables.
The Chi-square test
Here’s an example of a contingency table that would typically be tested with a Chi-Square Test of Independence:
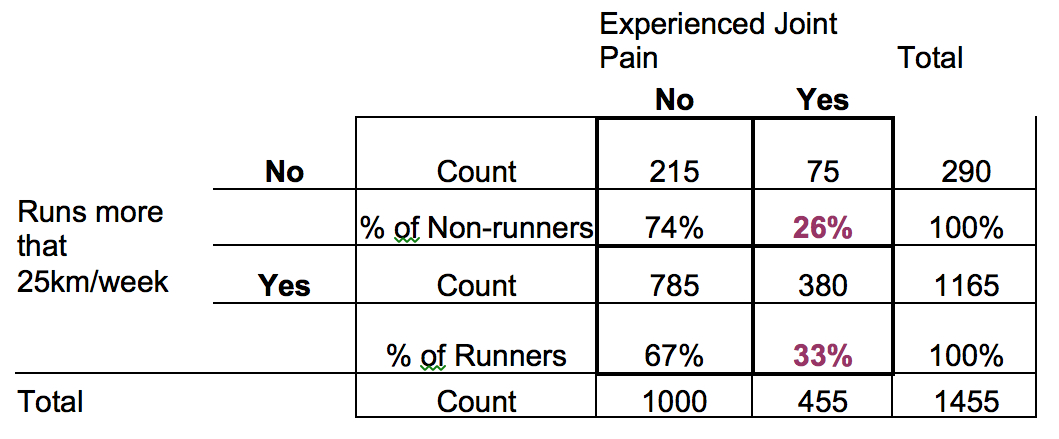
The Chi-Square will test whether Experiencing Joint Pain is associated with running more than 25km/week.
How is it doing that?
The chi-square statistic itself is calculated based on the counts of people in each of those four cells of the table and their subsequent row and column totals.
But the comparison it essentially boils down to is the comparison of the two purple percentages. You’ll notice each of these percentages is based on the row total. In other words, the 75 non-runners answering Yes to Joint Pain represent 26% of the 290 non-runners*.
But 33% of the 1165 Runners said Yes, they’ve experienced joint pain. A higher proportion of runners than non-runners are experiencing joint pain.
If those percentages were the same, the chi-square test statistic would be zero and it would mean that whether someone runs tells you nothing about whether they have joint pain.
So if those percentages were the same, we’d conclude the two variables are not associated.
Since our percentages aren’t the same, we conclude that running and joint pain are associated. (Feel free to check the p-value on this example).
*As a non-runner myself, I’m being strict here in the definition of a “runner” as someone who runs at least 25k/week. All others I’m calling non-runners for simplicity.
The McNemar Test
A McNemar test does something different.
The McNemar is not testing for independence, but consistency in responses across two variables.
It’s generally used in repeated measures or paired data situations.
Here is a table with the exact same counts, but different variables. Now we’re comparing whether someone experiences joint pain before and after some treatment. We want to test whether the treatment worked to change people from Yes to No.
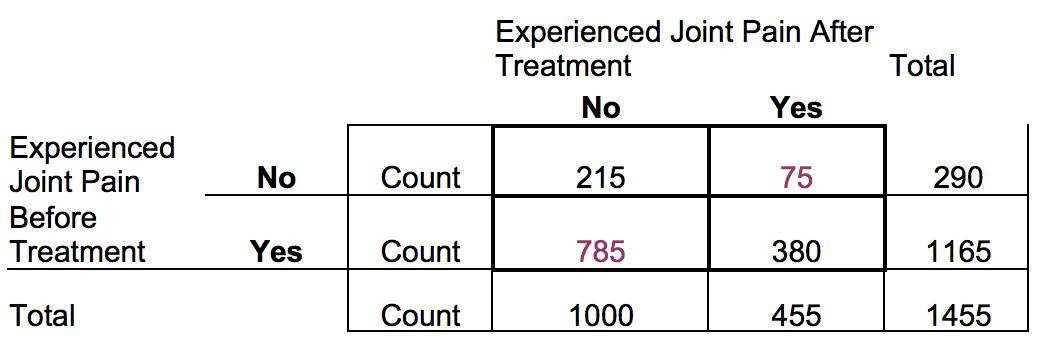
But the McNemar recognizes that some people will move from Yes to No and others from No to Yes just randomly. If the treatment is having no effect, the number of people who move from No to Yes should be about equal to those who move in the other direction.
But if there is a direction to the movement, one of those purple boxes will be different from the other.
The 215 people who said no at both time points and the 380 people who said Yes at both are irrelevant to this comparison. We want to know whether the people who change answers do so randomly or not.
In the McNemar test, we can compare counts directly, because the comparison is not based on row totals. But if changing to percentages makes interpretation easier, that’s fine too. Just make sure you use percentage of the total sample, not percentage of the row totals, as we did for Chi-square.
Go to the next article or see the full series on Easy-to-Confuse Statistical Concepts
McNemar test is for paired nominal data, which is not stated in the write-up. Since the data is paired that is why the numbers for the No/No and Yes/Yes are irrelevant.
What about wilcoxon signed rank test ?
I’m wondering two things:
First, is there a Fisher’s Exact Test equivalent to the McNemar’s test?
Second, if category membership is mixed between independent and dependent samples (e.g., some subjects could be represented across groups whereas some other subjects may not), does one use a chi-square or McNemar’s test?
Thank you in advance for your response!
How would I set up a contingency table if I were using McNemar test and doing a pre and post audit. Pre data 3 yes/47 no after education intervention,
post data yes 12/21 no. Thank you
Hi Karen,
I’m wondering how we’re able to only compare the purple values, 785 and 75. If we’re seeing if the people are randomly going from Yes to No and No to Yes, wouldn’t going Yes to No happen more frequently just because there are more people starting off with Yes?
Hi. Nice write up!
I’m just wondering how the McNemar test is only comparing the changes from No to Yes and Yes to No. For example, wouldn’t you expect more changes from
Yes to No than No to Yes if there were more people just starting off as Yes.
Hi,
loved your explanation. I would like to know how can I apply McNemar to compare baseline and end line data to see the shift in proportions/percentages? There is a drop out rate of 15% from the baseline to the end line (200 in the baseline and 171 in the endline).Please suggest with examples.
Thanking you in anticipation!
Regards,
Thanks for the helpful explanation, Karen!
Since the McNemar test uses paired data, is it more powerful than the chi-square test of independence, assuming the same general research question is being asked? Like how a paired t-test is more powerful than an independent t-test? Thanks!
Hi Rebecca,
I don’t think it necessarily is, but honestly, I’ve never seen the comparison.
Paired t-tests are more powerful than between subjects because although they’re essentially testing the same hypothesis about the equivalence of two means, a paired test is able to do it with a lot smaller error variance.
But McNemar and Chi-square are really testing two different hypotheses.
Ah, that makes sense. Thanks Karen!
when using McNemar’s test, what will be the sample (N)?
Nice explanation of the differences between these two Tests for categorial data. I love it.
If I want to compare any test value (eg. interferon-gamma level) among same group of people before and after treament or any intervention, which will be the ideal test?
The nature of data determines the type of test tool. The explanation here is for categorical data where data measure is nominal in nature (Yes or no, good or bad which represents the feelings or opinions of the sample.
For your test of comparison of interferon-gamma levels of pre and post-treatment intervention among same group, you need to use paired-sample t-test.
What if we have pre post but 3 group independent variable? It’s 3 by 2, can we proceed with mc nemar?
Nope. McNemar only works in a 2×2
What about he Cochrane Q? I thought it was an extension of McNemar test for the case of tables greater than 2X2.
Hi, I was wondering whether either of these tests would be appropriate for assessing the association between repeat questions which were inserted into a survey as measure of internal validity.
Hi, I am wondering whether there is a chi sq repeated measures equivalent where the data is not binary? I know you can use McNemar for 2×2 but my data includes >2 categories (likert not at all = 1 to very much = 5) and >2 time points (e.g. intake, progress 1, exit, follow up 1).
Thanks very much.
Hi Lauren,
Not that I know of for nominal variables or for 3 time points. You’d have to run a GEE logistic regression model with one predictor.
You can use stuert Maxwell test for greater than 3 categories it is an extension of Mc neymar’s test.