One of the many confusing issues in statistics is the confusion between Principal Component Analysis (PCA) and Factor Analysis (FA).
They are very similar in many ways, so it’s not hard to see why they’re so often confused. They appear to be different varieties of the same analysis rather than two different methods. Yet there is a fundamental difference between them that has huge effects on how to use them.
(Like donkeys and zebras. They seem to differ only by color until you try to ride one).
Both are data reduction techniques—they allow you to capture the variance in variables in a smaller set.
Both are usually run in stat software using the same procedure, and the output looks pretty much the same.
The steps you take to run them are the same—extraction, interpretation, rotation, choosing the number of factors or components.
Despite all these similarities, there is a fundamental difference between them: PCA is a linear combination of variables; Factor Analysis is a measurement model of a latent variable.
Principal Component Analysis
PCA’s approach to data reduction is to create one or more index variables from a larger set of measured variables. It does this using a linear combination (basically a weighted average) of a set of variables. The created index variables are called components.
The whole point of the PCA is to figure out how to do this in an optimal way: the optimal number of components, the optimal choice of measured variables for each component, and the optimal weights.
The picture below shows what a PCA is doing to combine 4 measured (Y) variables into a single component, C. You can see from the direction of the arrows that the Y variables contribute to the component variable. The weights allow this combination to emphasize some Y variables more than others.
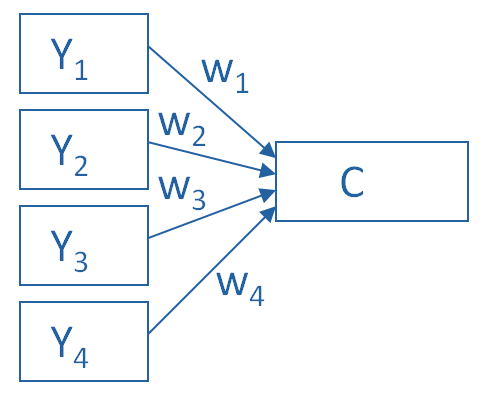
This model can be set up as a simple equation:
C = w1(Y1) + w2(Y2) + w3(Y3) + w4(Y4)
Factor Analysis
A Factor Analysis approaches data reduction in a fundamentally different way. It is a model of the measurement of a latent variable. This latent variable cannot be directly measured with a single variable (think: intelligence, social anxiety, soil health). Instead, it is seen through the relationships it causes in a set of Y variables.
For example, we may not be able to directly measure social anxiety. But we can measure whether social anxiety is high or low with a set of variables like “I am uncomfortable in large groups” and “I get nervous talking with strangers.” People with high social anxiety will give similar high responses to these variables because of their high social anxiety. Likewise, people with low social anxiety will give similar low responses to these variables because of their low social anxiety.
The measurement model for a simple, one-factor model looks like the diagram below. It’s counter intuitive, but F, the latent Factor, is causing the responses on the four measured Y variables. So the arrows go in the opposite direction from PCA. Just like in PCA, the relationships between F and each Y are weighted, and the factor analysis is figuring out the optimal weights.
In this model we have is a set of error terms. These are designated by the u’s. This is the variance in each Y that is unexplained by the factor.
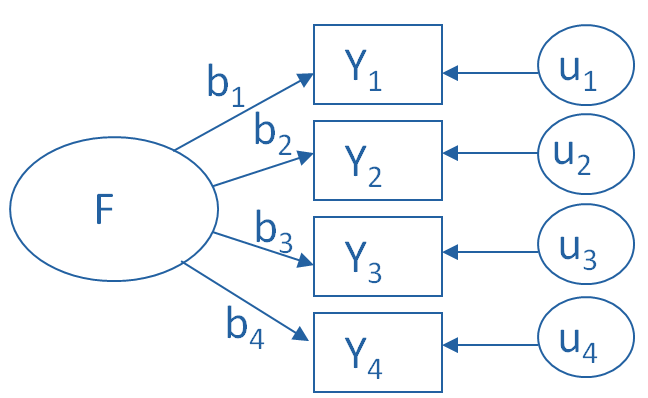
You can literally interpret this model as a set of regression equations:
Y1 = b1*F + u1
Y2 = b2*F + u2
Y3 = b3*F + u3
Y4 = b4*F + u4
As you can probably guess, this fundamental difference has many, many implications. These are important to understand if you’re ever deciding which approach to use in a specific situation.

Thanks for simple and accurate explanation
I enjoyed the brief note, which is well explained and easy to understand. Thank you very much!
Thanks so much because my head was bursting trying to understand the differences how can I quote the source, please?
The fundamental difference is that Principal Components Analysis does not impose testable restrictions on the parameterization of the covariance matrix. This is because any real symmetric matrix can be decomposed into its eigenvalues and eigenvectors. PCA computes that decomposition, and then the user selects the linear combinations he thinks are most important. However, the identity between the covariance matrix and its decomposition means that PCA does not restrict the structure of the covariance matrix. Every covariance matrix can be decomposed into its principal components.
On the other hand, when the Factor Analysis model is written mathematically and the covariance matrix is computed, one can see that the factor loadings enter into the covariance matrix as squares and cross products. Factor analysis therefore imposes parameter restrictions on the covariance matrix that can be tested statistically. Therefore, unlike PCA, NOT every covariance matrix can be represented by the Factor Analysis model.
Thanks so much for explaining the differences between factor analysis and principal component analysis in such a clear way. I have checked many other versions about the two over the Internet, this post is the best one.
Not a good explanation. Why the direction of pca and fa required to be opposite. What is the difference of pca and fa regarding the mathematical approach is not mentioned. I can not connect the explanation with the mathematical concept that I possessed.
Hi Rashidul,
We try here to help people understand the concepts and meanings without getting much into the math. If you prefer to see the math (some people do) there are many options out there.
Very good explanation to use for people who are not statistically sophisticated.
Very nice explanations. The fundamental concepts are explained in very simple language and informative graphs. Thank you so much.
Hi,
Very nice graphical explanation! Can you please tell me how I can cite the graphs?
Many thanks,
Vasilis
This is a good explanation of the underlying theoretical difference between PCA and FA. Great. But you close with “As you can probably guess, this fundamental difference has many, many implications. These are important to understand if you’re ever deciding which approach to use in a specific situation.”
But then you don’t discuss at all what the implications are or how a user is supposed to decide which method to use. That would make this a much more useful document.
No where is the above description of PCA does it describe how the individual variables tie together to create the component. How does W1 relate to W2? Why do those two particular variables group together? It simply states that these four variables consolidate together to create a single component and the weights of those single factors shape the nature of the component.
The interpretation appears to be quite comprehensive. Thanks.
I’m afraid I don’t get it:
In case of PCA, components will emerge from some variables because these variables are somehow connected at a conceptual level. If they describe similar things than they will load on the same component. So here, there is also a latent variable like in Factor Analysis.
Congrats! This is the number one link when you google Principal Components vs Factor Analysis
Good explanation
Yes.
I have been struggling to get the difference between these two methods but now i got it clearly
Very good explanation. I going to use to explain my students.
Regards
Fantastic explanation!!! Thanks,
Really precise and nice explanation.
I guess it is good to mention that PCA is an estimate method of explanatory factor analysis model to obtain common (latent) factors. However, the opposite isn’t true. There are also many other methods of obtaining common latent factors such as Maximum Likelihood method which does not use eigenvalues and eigenvectors I guess. Lastly, that error term included in the EFA model plays a huge role in getting common factors or computing factor scores. But, PCA is a linear combination of total variance including error.
Hi Sala, thanks for the answer. Do you have any sources which state that PCA is an estimate method of EFA?
Thanks a lot! I’ve been finally able to grasp the difference!
Thank you. good explanation!
I read the differences between them but this is the most understandable article.
This is easy to understand.
great explanation. easy to comprehend! Thanks!
Very good explanation!