Latent constructs, such as liberalism or conservatism, are theoretical and cannot be measured directly.
But we can represent the latent construct by combining a set of questions on a scale, called indicators. We do this via factor analysis.
Often prior research has determined which indicators represent the latent construct. Prudent researchers will run a confirmatory factor analysis (CFA) to ensure the same indicators work in their sample.
You can run a CFA using either the statistical software’s “factor analysis” command or a structural equation model (SEM). There are several advantages to using SEM over the “factor analysis” command. The advantage we will look at is the ability to incorporate correlated errors.
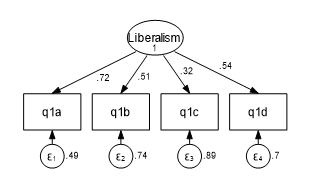
The first step in a CFA is to verify that the indicators have some commonality and are a good representation of the latent construct. We cannot simply sum up the scores of all indicators to create the latent factor.
Why? The indicators do not equally represent the latent construct. They each have their own “strength,” represented by its loading onto the latent factor. The loading is the variance of the indicator that is shared with the latent factor.
Not all the variance of an indicator is shared. Unique variance is the leftover, unshared variance. We consider unique variance as measurement error since it doesn’t help measure the latent construct. We can represent it as an error term in our model.
Correlated Errors
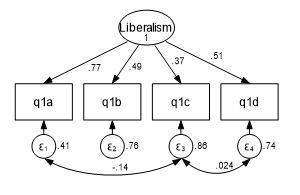
Sometimes, part of the measurement error of one indicator is partially correlated with the measurement error of another indicator. This correlation could come from pure randomness or from something that influences both indicators.
If there is a legitimate reason for a correlation between indicators’ error terms, you can do this in a structural equation model. What are legitimate reasons?
According to Timothy Brown in his book “Confirmatory Factor Analysis for Applied Research”, a few possibilities are:
- Acquiescent response: a response bias caused by a person agreeing with attitude statements regardless of the content of the question
- Assessment methods: questionnaire, observer ratings
- Reversed or similarly worded test items
- Personal traits: reading disability or cognitive biases such as groupthink, which affect a respondent’s ability to answer a questionnaire truthfully
Modification Indices
To determine which indicators’ error terms have a high correlation, we generate a modification index. The index measures how much the model’s goodness of fit will improve if any two specific error terms are correlated.
Please note, you must be able to justify that the error terms should be correlated. For example, if the latent construct comes from a survey, you need to review the questions to determine if the two questions relate to the same topic.
What is the advantage of correlating the error terms?
Correlating indicator error terms can improve the reliability of the latent construct’s scale, as measured via goodness of fit statistics.
Unfortunately, correlating error terms is not possible in a software’s “factor” command, though it’s quite simple to implement within a structural equation model.
Jeff Meyer is a statistical consultant with The Analysis Factor, a stats mentor for Statistically Speaking membership, and a workshop instructor. Read more about Jeff here.
Hi,
I have a second-order construct with two first-order factors under it. Can I correlate errors within these first-order factors? After all, they are part of the same construct, so there will be similarities in measuring and responses?
Thanks.
Hi,
You can correlate the error terms but the question is, should you correlate them. Here is a link to a paper which discusses whether to correlate error terms.
http://cmss.univnt.ro/wp-content/uploads/vol/split/vol_III_issue_1/CMSS_vol_III_issue_1_art.001.pdf
Jeff
1) If overlapping indicators are theoretically to be expected in some models, what would be the best alternative to correct the fit indices and reliability of the model?
2) Would correlated errors in a specific sample (e.g. indicator A~~B) indicate that the items would have the same meaning?
Hi
Are there any rules about the number of errors that we can correlate in the same dimension?
Hi Teresa,
You should only correlate errors when you can truly justify it. It is similar to over fitting a regression model. You shouldn’t correlate errors simply to improve model fit.
Here are two articles that I recommend you reading.
The problem of allowing correlated errors in structural equation modeling: concerns and considerations, by Richard Hermida
The Insidious Effects of Failing to Include Design-Driven Correlated Residuals in Latent-Variable Covariance Structure Analysis, by David Cole, Jeffrey Ciesla and James Steiger
Jeff