I love working with my clients.
I love working with my clients for many reasons, but one of them is I learn so much from them.
Just this week, one of my clients showed me how to get SPSS GENLINMIXED results without the Model Viewer.
She’s my new hero.
If you’ve ever used GENLINMIXED, the procedure for Generalized Linear Mixed Models, you know that the results automatically appear in this new Model Viewer.
It’s this weird fancy-graphical-looking-but-extremely-cumbersome-to-use thingy within the output window.
I was very happy when SPSS came out with Generalized Linear Mixed Models in version 19. Before that I had to tell clients that the only way to analyze their repeated measures logistic regression model was in some other software.
It’s a great way to ruin someone’s day–tell them they need to attempt SAS or R programming for the first time while learning extremely complicated statistical models.
So I was glad that SPSS became an option for generalized linear mixed models.
But that Model Viewer had led me to nearly give up that option. It’s that annoying. (Google it if you’re curious about the hate for the Model Viewer).
Anyway, there is now a way to get rid of it.
I have SPSS version 22 and I don’t know if this option has existed all along or if it’s new.
To Get Rid of the Model Viewer in SPSS:
Go to the Edit Menu and choose Options (it’s at the bottom).
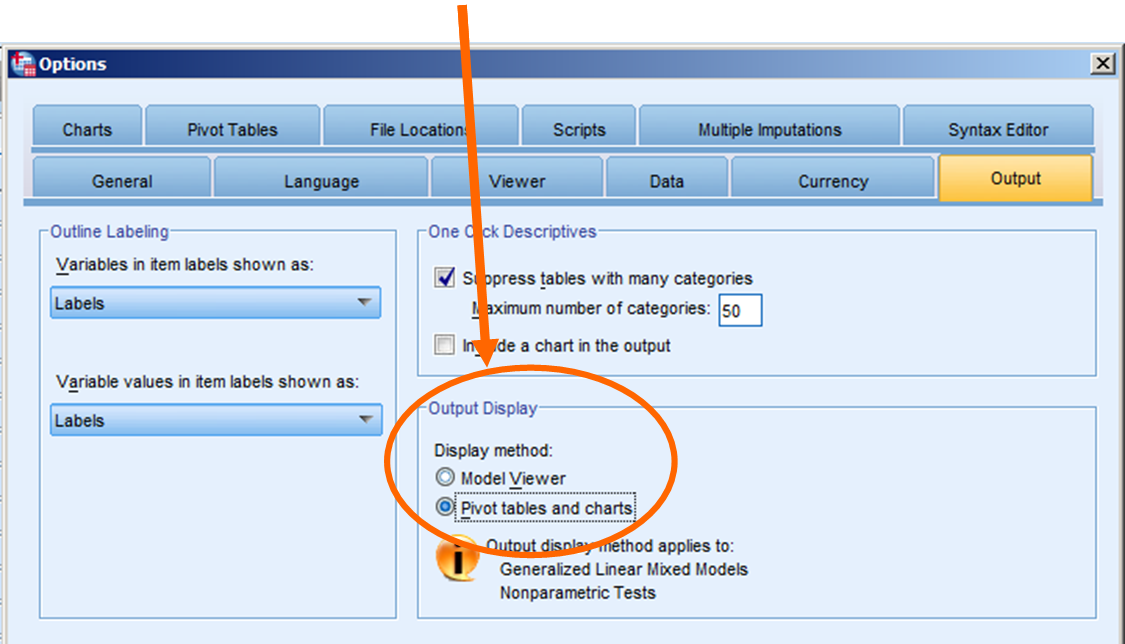
Choose the Output tab.
Under Output Display, there are two Display methods. “Model Viewer” will be chosen by default. Change it to “Pivot Tables and Charts,” Click OK.
That’s it! It takes about 30 seconds.
You’ll get all the same output, but each table and graph will be a separate object within the output window. Much easier to work with.
If you have a version of SPSS from 19-21, let me know in the comments if it works for you as well.

This doesn’t work for me on SPSS v25. I changed from model viewer to pivot table and charts and nothing happens 🙁 any advice?
Hi Lauren,
I never used v25. I recently skipped up from 22 to 28. I just checked it in 28, and the option is still there in the Output tab of Edit–>Options. But the system default is now set at “Pivot tables and charts” instead of “Model Viewer.” I’m not sure that switched, but let me just say Thanks! to the IBM SPSS development team.
The only advice I have is to contact IBM support. It seems like it should still be working in V. 25.
THANK YOU!!
Thank you so much for this – the Model Viewer has been driving me crazy, especially when trying to go through the output on screen with colleagues. Your simple advice is brilliant.
Thank you so much for posting this!! I was struggling with the model viewer (using non-parametric tests) and I am so relieved there is a way to get rid of it! Great!
🙂 A client showed me a while ago and I had the same reaction!
Hullo,
Please I’m working with SPSS 20 but I’m still struggling, I need an output in tables. The edit is not helping me. My display is showing output lables instead of output. How do I proceed.
Thanks
Hi Anthony,
I don’t think there is any way to do what I’m suggesting in SPSS 20.
Aaaaah! Great 🙂 Oh this is really really better. Thank you so much!!!
YES! Worked on v21. I cannot thank you enough for this posting.
OMG Thank you so much for this! I went to run my first ever genlinmixed model and saw this ridiculous model viewer and just wanted to cry. I didn’t know what I was doing wrong or why my output didn’t look anything like I had ever seen before. This post saved the day, thank you, thank you, thank you!
The Options tabs are different in SPSS 20. There is an Output Labels tab but no Output tab. I checked all the tabs for a similar option, but no luck. I hate SPSS GENLINMIXED output so much…