 In a simple linear regression model, how the constant (a.k.a., intercept) is interpreted depends upon the type of predictor (independent) variable.
If the predictor is categorical and dummy-coded, the constant is the mean value of the outcome variable for the reference category only. If the predictor variable is continuous, the constant equals the predicted value of the outcome variable when the predictor variable equals zero.
Removing the Constant When the Predictor Is Categorical
When your predictor variable X is categorical, the results are logical. Let’s look at an example.
I regressed the weight of an auto on where the auto was manufactured (domestic vs. foreign) to produce the following results.

Look at the Coef. column. It tells us the mean weight of a car built domestically is 3,317 pounds. A car built outside of the U.S. weighs 1,001 pounds less, on average 2,316 pounds.
Most statistical software packages give you the option of removing the constant. This can save you the time of doing the math to determine the average weight of foreign built cars.
The model below includes the option of removing the constant.
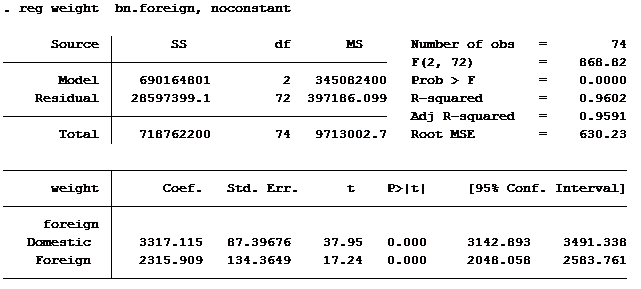
The domestic weight is the same in both outputs. In the output without the constant, the mean weight of a foreign built car is shown rather than the difference in weight between domestic and foreign built cars.
Notice that the sum of the square errors (Residuals) is identical in both outputs (2,8597,399). The t-score for domestically built cars is identical in both models. The t-score for foreign is different in each model because it is measuring different statistics.
The Impact on R-squared
The one statistical measurement that is very different between the two models is the R-squared. When including the constant the R-squared is 0.3514, and when excluding the constant it is 0.9602. Wow, makes you want to run every linear regression without the constant!
The formula used for calculating R-squared without the constant is incorrect. The reported value can actually vary from one statistical software package to another. (This article explains the error in the formula, in case you’re interested.)
If you are using Stata and you want the output to be similar to the “no constant” model and want accurate R-squared values then you need to use the option hascons rather than noconstant.
The impact of removing the constant when the predictor variable is continuous is significantly different. In a follow-up article, we will explore why you should never do that.
Jeff Meyer is a statistical consultant with The Analysis Factor, a stats mentor for Statistically Speaking membership, and a workshop instructor. Read more about Jeff here.

Hi Jeff,
I’m running a binary logistic regression with categorical predictors (3 categories). How will removing the constant affect the interpretation of the odds ratio?
When I keep the constant in the model the chi-square p-value over the null model is non-significant. But on removing the constant it becomes significantly better. I am using Stata 15
Hi,
If you remove the constant you are no longer comparing a category’s odds to the odds of the reference (base) category. The output is the odds of an event happening for that category. The p-value is testing whether the odds are greater than 1 or less than one. You will get an insignificant p-value if the lower CI is less than 1 and the upper CI is greater than 1.
The impact of OLS results when the constant is omitted from the regersson model.
Secondly, the effects of the OLS results when the error term is not added to the regression equation.
Jeff,
Thank you for your geat article. It always provides a lot of insights.
From your article, let’s assume that we add another categorical variable with three levels. Then can we use the coefficients values and t-scores from the model without constant to compare the effect of each level among two variables (including base level) and their statistical significance?
If not, is there any other way to do this?
Thanks for your time!
Kim
Hi Kim,
If you leave out the constant and add another categorical variable you will still be without a “base” category. The best way to compare statistical significance between categorical predictors is to run a pairwise comparison. Every statistical software package is capable of running these tests. If you run a google search for pair wise comparison and the name of your software you will find out how to do it.
Jeff