
Multicollinearity is one of those terms in statistics that is often defined in one of two ways:
1. Very mathematical terms that make no sense — I mean, what is a linear combination anyway?
2. Completely oversimplified in order to avoid the mathematical terms — it’s a high correlation, right?
So what is it really? In English?
Well, ultimately multicollinearity is a situation where multiple predictors in a regression model are overlapping in what they measure. In other words, each variable doesn’t give you entirely new information.
This makes it hard for the regression model to estimate the effect of any given predictor on the response. If the predictors overlap, how can you tell which one is really associated with the response? Or if they both are related to the response, how do you measure each of those individual relationships?
No Multicollinearity
To really picture what multicollinearity is, let’s start by picturing what it is not.
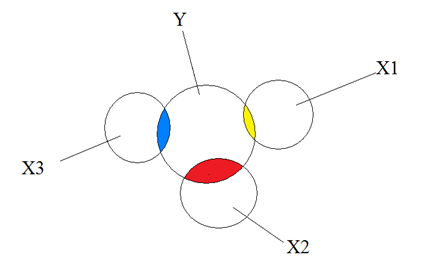
In this diagram, we have a model with three predictors—X1, X2, and X3—and one response variable, Y.
The colored sections are where each X explains some of the variance in Y.
As you can see, the Xs don’t overlap at all—each is distinctly measured. If you checked correlations, each X would have a mild correlation with Y, but the Xs would not correlate at all with each other. In other words, each one measures unique information. Knowing the value of one X variable tells you nothing about the value of another.
So it’s easy to measure the relationship of say, X1 with Y—it’s the yellow section and that is what the regression coefficient will report. This coefficient will be identical for a model where X1 is the only predictor as in a model where all three Xs are in together.
Some people will tell you that this complete independence among the Xs is an assumption of regression, but it’s not. It’s pretty rare to ever have a data set where every predictor that is related to Y is not related to each other.
It does, however, affect the way you interpret your coefficients. If you want to interpret each X’s coefficient as the independent effect of that X on Y, then yes, you’re making an assumption that all Xs are independent.
Moderate and Extreme Multicollinearity
But more common is to have a moderate overlap. The overlap can become so extreme that the model becomes unstable. Let’s look at both situations.
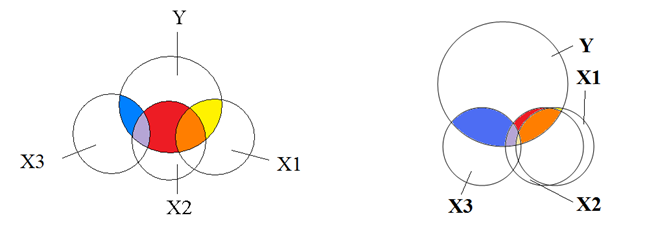
On the left is the situation where there is mild overlap among the predictors. We can still measure the unique effect of each predictor on Y—those are the yellow, red, and blue sections.
The regression coefficients do not include the orange and purple sections. This means the coefficients themselves are not telling you the full picture of the effect of each predictor on Y.
As long as you keep that in mind as you interpret coefficients, you’re not violating assumptions and your model is reliable. But you can’t tell if that orange section is really attributable to X1 or X2. Or if that distinction even has any meaning. There is no way to distinguish them.
But in the situation on the right, the overlap between X1 and X2 becomes so extreme that it can cause the model to have estimation problems. This is usually what we mean when we say we have multicollinearity.
The model is trying to estimate the unique effect of each predictor on Y, but there just isn’t enough unique information about X1 and X2 to calculate it.
If when X1 goes up, so does X2, how can you separately estimate the effect of a one unit increase of X1 on Y and X2 on Y?
There are so many possible reasonable estimates for the unique effect of X1 on Y that even though the coefficient is unbiased, it will have a huge standard error. This is variance inflation.
The coefficient’s estimate is imprecise and you’ve very likely to get a different coefficient in a different sample.
When multicollinearity becomes perfect, you find your two predictors are confounded. You simply cannot separate out the variance in one from the variance in the other.

Thanks a lot Madam Karen and well received
Thank you. Very helpful in visualising multicollinearity and confounding. Could interaction be explained equally clearly via visualisation?
Hello,
I’ve used a multilevel model for my work (I’m new to it, but the question warranted that level of analysis). I am in the process of doing multicollinearity tests. I did do some other testing, but I ended up using categorical independent variables in my model. With suggestions from a colleague I ran the analysis and it suggested moderate collinearity. However, I am not sure I did it correctly. I used SAS and I used a proc reg statement. I am not sure that is correct considering I have a binary outcome variable and categorical Independent variables. Should I use the proc reg to test for multicollinearity? I’ve read that people have used chi square, is that more appropriate? Thank you for any advice that you can give.
Proc reg will definitely give you multicollinearity stats like VIF that proc mixed or proc glm won’t. You wouldn’t want to report the results of the proc reg for the analysis, but it’s fine to do for the multicollinearity tests.
Great! Thank you so much!!
Lauren
This is an excellent explanation of multicollinearity – thanks so much.
Are the two problems of multicollinearity independent of each other?
In other words, can multicollinearity cause predictor coefficient estimates to be unstable to changes in the sample, yet still come out significant (little variance inflation)?
Thanks!
They’re not independent of each other. It is literally the instability (measured by high standard errors) that will lead to a low t-statistic for that variable (and a corresponding high p-value).
That said, because “signficance” is based on an arbitrary cutoff, it IS possible that the variance inflation isn’t SO big that it leads to a high enough p-value to no longer be significant. So yes, it’s possible to have some multicollinearity and some variance inflation, and yet still have a reasonably stable estimate.
Can you calculate an “index variable” (or a similar term, depending on what field you’re in) which combines the effects of X1 and X2 into one variable? For example if X1 is ‘smoking’ and X2 is ‘air pollution’, you could make a variable called “air quality” which is a composite of smoking and air pollution. It could be, for example, number of cigarettes smoked daily plus the proportion of days of the year that have high ozone levels. (You would compute this before throwing it into a regression model, of course).
Hi Jerry,
Yes, you absolutely can. An index variable doesn’t always make sense, but if it does, it’s a great solution. If you have more than two or three variables, you can use tools like Principal Component Analysis to do it.
Can the circles be given a mathematical meaning? For instance, in which space/set do these circles live?
Or should I just think of these diagrams as “just” a cool visual aid?
Hi Victor,
They are the variances of each variable.