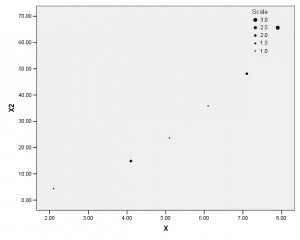
One of the most common causes of multicollinearity is when predictor variables are multiplied to create an interaction term or a quadratic or higher order terms (X squared, X cubed, etc.).
Why does this happen? When all the X values are positive, higher values produce high products and lower values produce low products. So the product variable is highly correlated with the component variable. I will do a very simple example to clarify. (Actually, if they are all on a negative scale, the same thing would happen, but the correlation would be negative).
In a small sample, say you have the following values of a predictor variable X, sorted in ascending order:
2, 4, 4, 5, 6, 7, 7, 8, 8, 8
It is clear to you that the relationship between X and Y is not linear, but curved, so you add a quadratic term, X squared (X2), to the model. The values of X squared are:
4, 16, 16, 25, 49, 49, 64, 64, 64
The correlation between X and X2 is .987–almost perfect.

To remedy this, you simply center X at its mean. The mean of X is 5.9. So to center X, I simply create a new variable XCen=X-5.9.
These are the values of XCen:
-3.90, -1.90, -1.90, -.90, .10, 1.10, 1.10, 2.10, 2.10, 2.10
Now, the values of XCen squared are:
15.21, 3.61, 3.61, .81, .01, 1.21, 1.21, 4.41, 4.41, 4.41
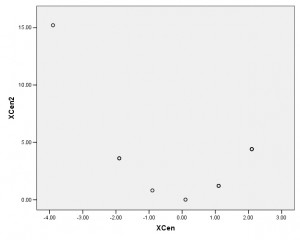
The correlation between XCen and XCen2 is -.54–still not 0, but much more managable. Definitely low enough to not cause severe multicollinearity. This works because the low end of the scale now has large absolute values, so its square becomes large.
The scatterplot between XCen and XCen2 is:

If the values of X had been less skewed, this would be a perfectly balanced parabola, and the correlation would be 0.
Tonight is my free teletraining on Multicollinearity, where we will talk more about it. Register to join me tonight or to get the recording after the call.


Hi, I have an interaction between a continuous and a categorical predictor that results in multicollinearity in my multivariable linear regression model for those 2 variables as well as their interaction (VIFs all around 5.5). Whenever I see information on remedying the multicollinearity by subtracting the mean to center the variables, both variables are continuous. Should I convert the categorical predictor to numbers and subtract the mean? Thanks!
Hi Pamela,
The equivalent of centering for a categorical predictor is to code it .5/-.5 instead of 0/1.
I teach a multiple regression course. I tell me students not to worry about centering for two reasons.
1. It doesn’t work for cubic equation.
2. Whether they center or not, we get identical results (t, F, predicted values, etc.).
Any comments?
Hi Kamo,
You’re right that it won’t help these two things. The biggest help is for interpretation of either linear trends in a quadratic model or intercepts when there are dummy variables or interactions. See these:
https://www.theanalysisfactor.com/interpret-the-intercept/
https://www.theanalysisfactor.com/glm-in-spss-centering-a-covariate-to-improve-interpretability/
If you center and reduce multicollinearity, isn’t that affecting the t values?
Does it really make sense to use that technique in an econometric context ?
To me the square of mean-centered variables has another interpretation than the square of the original variable. Imagine your X is number of year of education and you look for a square effect on income: the higher X the higher the marginal impact on income say. So you want to link the square value of X to income. If X goes from 2 to 4, the impact on income is supposed to be smaller than when X goes from 6 to 8 eg. When capturing it with a square value, we account for this non linearity by giving more weight to higher values. A move of X from 2 to 4 becomes a move from 4 to 16 (+12) while a move from 6 to 8 becomes a move from 36 to 64 (+28). If we center, a move of X from 2 to 4 becomes a move from -15.21 to -3.61 (+11.60) while a move from 6 to 8 becomes a move from 0.01 to 4.41 (+4.4). So moves with higher values of education become smaller, so that they have less weigh in effect if my reasoning is good. It seems to me that we capture other things when centering.
I have a question on calculating the threshold value or value at which the quad relationship turns. The formula for calculating the turn is at x = -b/2a; following from ax2+bx+c. My question is this: when using the mean centered quadratic terms, do you add the mean value back to calculate the threshold turn value on the non-centered term (for purposes of interpretation when writing up results and findings).
Yes, the x you’re calculating is the centered version. So to get that value on the uncentered X, you’ll have to add the mean back in.